BI & Reporting — User Guide
Build live dashboards and reports from your SQL databases. This guide covers every feature, from your first chart to folders, permissions, sharing, scheduling and multi-server runs.
01Concepts
The building blocks, and how they fit together.
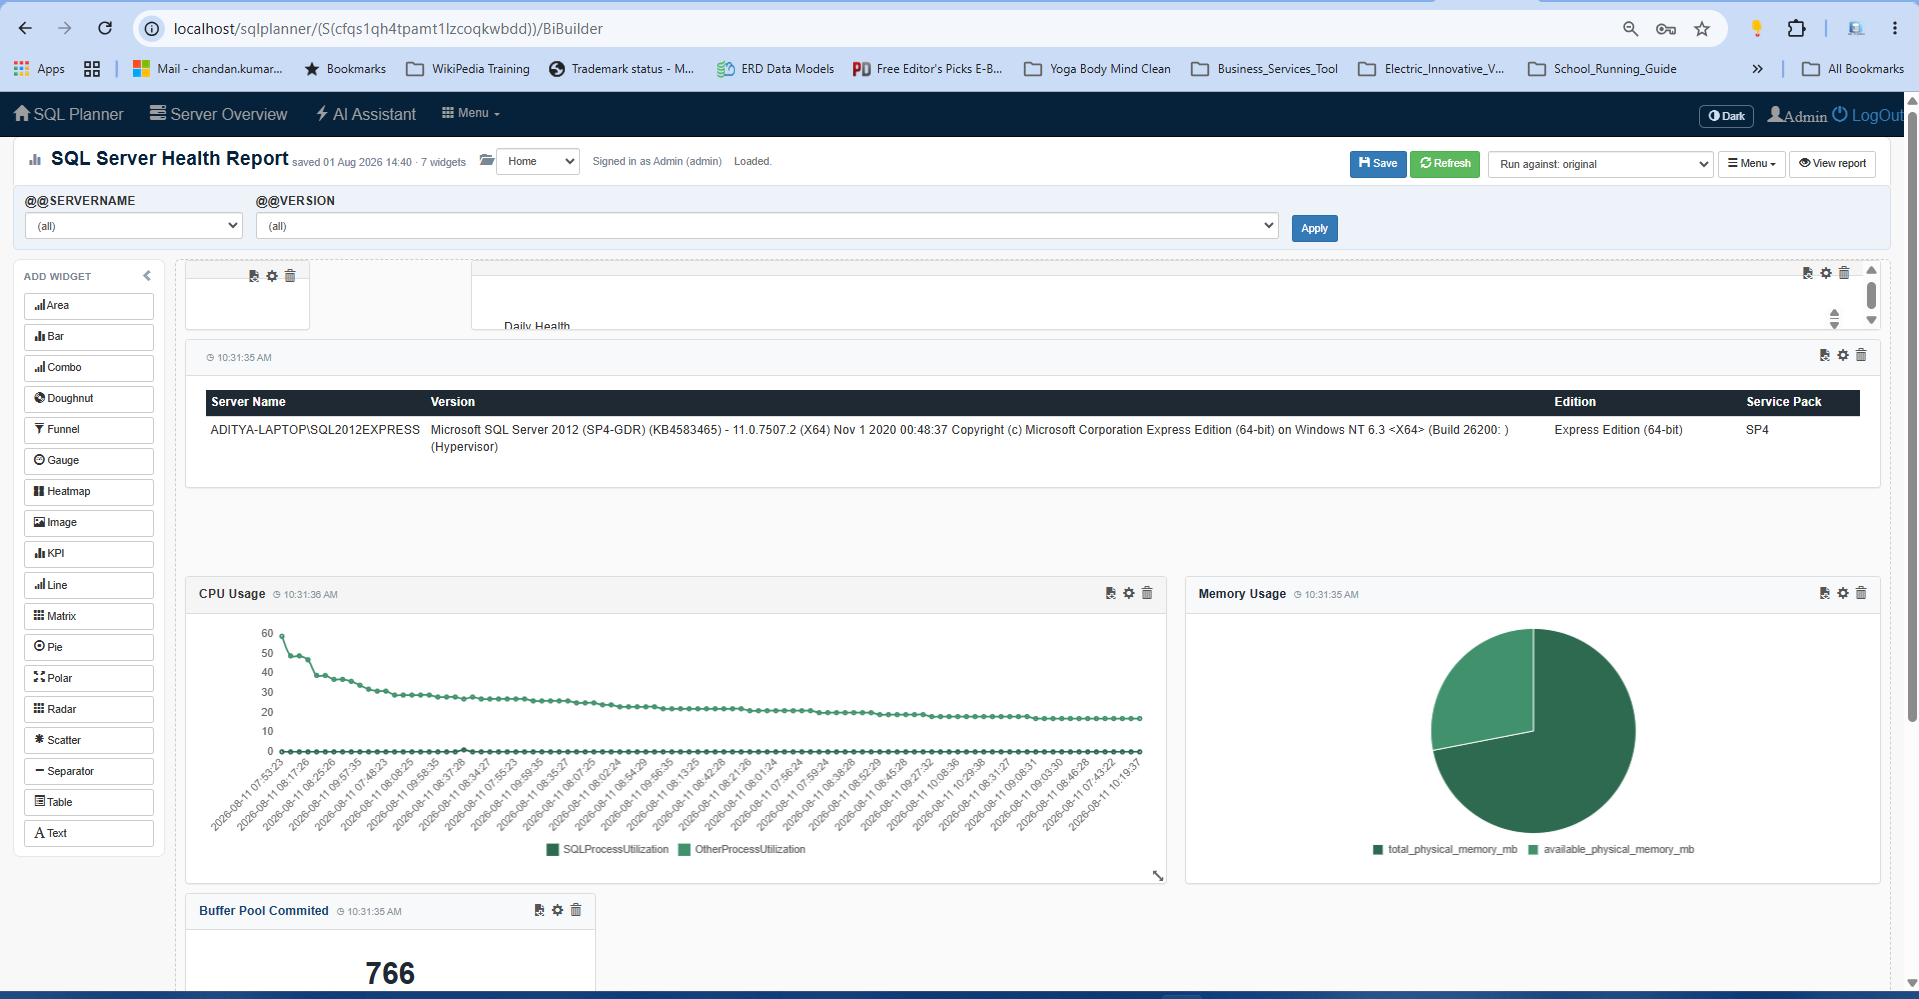
A report (or dashboard) is a canvas of widgets. Each widget runs one SQL query against a connection and draws the result — a chart, table, pivot or single number. Parameters filter the whole report at once; folders organize reports and control who can see them; share links and subscriptions deliver a report to people who never open the builder.
There are two screens: the Builder, where you design a report, and the Viewer, a clean read-only view for consuming it — with its own parameter bar, refresh, export and server switcher.
02Quick start — your first report
Blank canvas to a saved chart in a few minutes.
- In the Builder, click a widget in the Add widget rail (start with Bar or Table). It appears on the canvas.
- Click the widget's gear icon to open Widget properties on the right.
- Pick a Connection and type your SQL query. Use Expand for a large editor.
- Click Run, then choose the Label column (X axis / row labels) and one or more Value columns (the numbers), and press Apply.
- Drag to position, drag edges to resize.
- Click the title to rename the report, pick a folder, then Save.
- Press View report to see the audience's view.
03Connections
Where the data comes from.
A connection points at one database server. SQL Planner connects to SQL Server, PostgreSQL, MySQL, MariaDB, Percona, Amazon Aurora (MySQL and PostgreSQL), Amazon Redshift and Oracle. Open Menu › Data › Connections to add, edit or test them. Each widget chooses a connection in its properties, and its query runs against that server. The same list powers the Run against switcher, so a report can be pointed at other servers later.
04Widgets & chart types
Pick the shape that fits the question.
| Type | Best for |
|---|---|
| Bar / Line / Area | Comparing or trending values across a category or time. |
| Pie / Doughnut / Polar / Radar | Parts of a whole, or multi-axis comparisons. |
| Scatter | The relationship between two numeric columns. |
| Table | Row-level detail with conditional formatting. |
| Matrix | Rows × columns of aggregated values — see section 8. |
| KPI | One big headline number. |
| Separator | A titled divider to group the canvas visually. |
Switch a widget's type any time from the Chart type dropdown — the same query re-draws in the new shape.
05Queries & parameters
Plain SQL, with filters your viewers control.
Type SQL in the widget's SQL query box, or click Expand for a full-screen editor.
Return the columns you want to plot, and reference a parameter with @Name:
SELECT Category, SUM(Amount) AS Total
FROM Sales
WHERE Region IN (@Region)      -- multi-value parameter
  AND OrderDate >= @FromDate    -- single-value parameter
GROUP BY Category
ORDER BY Total DESC;
IN (@Name), never
= @Name, for a multi-select parameter. The list is expanded to the right number of
values automatically.Defining parameters
Open Data › Parameters. Each parameter has a name (used as @Name), a
type, and optionally a lookup query that fills its dropdown from the database. Turn on
Allow multiple for a checkbox picker. Viewers change parameters and press Apply;
every widget re-runs.
06Shared datasets
Write a query once, reuse it everywhere.
Open Data › Datasets to save a named query against a connection. In a widget's properties, switch Data source from Inline SQL to a dataset. Update the dataset once and every widget that uses it follows.
07Filter, sort & cross-filter
Shape the data after it's fetched — no SQL changes needed.
In a widget's properties, open Filter / Sort / Top N to keep matching rows, order the result, or show just the top N. Use the widget's Settings for calculated fields and conditional formatting.
Cross-filtering: click a bar, slice or point in one chart and the other widgets filter to that value. A chip shows the active cross-filter — clear it, or just Refresh, to reset.
08Pivot matrix
Turn flat rows into a rows-by-columns grid of aggregates.
Choose the Matrix type, then set the Matrix layout:
- Row group(s) — one or more columns down the left (nested grouping).
- Column headers — a column whose distinct values become the columns across the top; leave as (none) for a simple grouped total.
- Value column and Aggregation — Sum, Count, Average, Min or Max.
Example — rows server_name, columns schedule_name, value
duration, aggregation Sum: servers down the side, schedules across the top, summed
durations in the grid.
09Report settings
Appearance and limits for the whole report.
Open Report › Settings to set the subtitle, title alignment / size / color, a theme, header and footer text and rules, PDF orientation, and the Maximum rows per widget.
10Folders & permissions
Organize reports, and decide who can do what with them.
Open Data › Folders & Permissions. Reports live in folders (everything starts in Home). Move a report between folders from the title-bar picker, the row menu in Open, or the report browser.
Permissions (admins)
Click Permissions on a folder to open the user grid. For each user, tick any of:
| Right | Grants |
|---|---|
| View | See and open the reports in that folder. |
| Create | Make new reports in the folder (and move reports into it). |
| Write | Edit and save the reports in the folder. |
| Delete | Delete reports in the folder. |
Changes save instantly. Admins always have full access; a report's owner always keeps full control of their own reports.
12Email subscriptions
Send a report to inboxes on a schedule.
Open Report › Subscribe to schedule delivery — recipients, a format and a cadence. The report runs on schedule and is emailed out, so people get the numbers without opening the app.
13Run against a server
One report, any server — ideal for health checks across environments.
Use the Run against dropdown on the title bar (and in the viewer). Pick a connection and every widget runs its same SQL against that server instead of its saved one. It's a temporary override — the saved report never changes — so you can point a "database health" report at each server in turn. Choose original to go back.
14Copy a report as a template
Start from an existing report, or move one between servers.
Open Data › Template for three options:
- Duplicate — an instant copy of this report (widgets, parameters, layout) in the same folder.
- Export as JSON — copy the report's whole definition as text you can keep or paste elsewhere.
- Import as new report — paste an exported JSON to build a brand-new report from it, even on another instance.
Every duplicate or import creates fresh records — nothing overwrites the original. You need view rights to export or duplicate, and create rights in the target folder to import.
15Usage analytics
See what's being used, and by whom.
Open Data › Usage for the most-viewed reports and most active users over a period. Filter by a specific report or user, and click any row to drill in.
16Viewing & exporting
The read-only experience your audience gets.
The Viewer shows the report with its parameter bar, a Refresh button, the Run against switcher, and Export to Excel, CSV, PDF or PNG. Interactions like cross-filtering work here too. Press View report in the builder to open it.
17Tips & troubleshooting
| If… | Then… |
|---|---|
| A table or matrix shows fewer values than the chart | Check the parameter is written as IN (@Name), and clear any active
cross-filter (Refresh resets it). |
| A table is capped at 5,000 rows | Raise Maximum rows per widget in Report › Settings. |
| A SQL edit didn't stick | After Use this SQL, press Run or Save — Save commits the open panel automatically. |
| You can't see a report someone mentioned | Ask an admin for View on that report's folder, or request a share link. |
| A share link says "not valid" | It may have expired or been revoked — create a fresh one from Share. |


