
Turn your SQL databases into live dashboards and shareable reports.
Build charts, pivot tables and KPIs straight from SQL Server, PostgreSQL, MySQL, MariaDB, Percona, Amazon Aurora, Amazon Redshift and Oracle — driven by the parameters your users choose. No extra BI stack, no data copies. It runs where your data already lives.
Get started Take the tourFrom raw SQL to a dashboard your whole team can read
Write a query, pick a chart, drop in a filter. The BI module handles the layout, the caching, the sharing and the scheduling — so a report you build once keeps working for everyone who opens it.
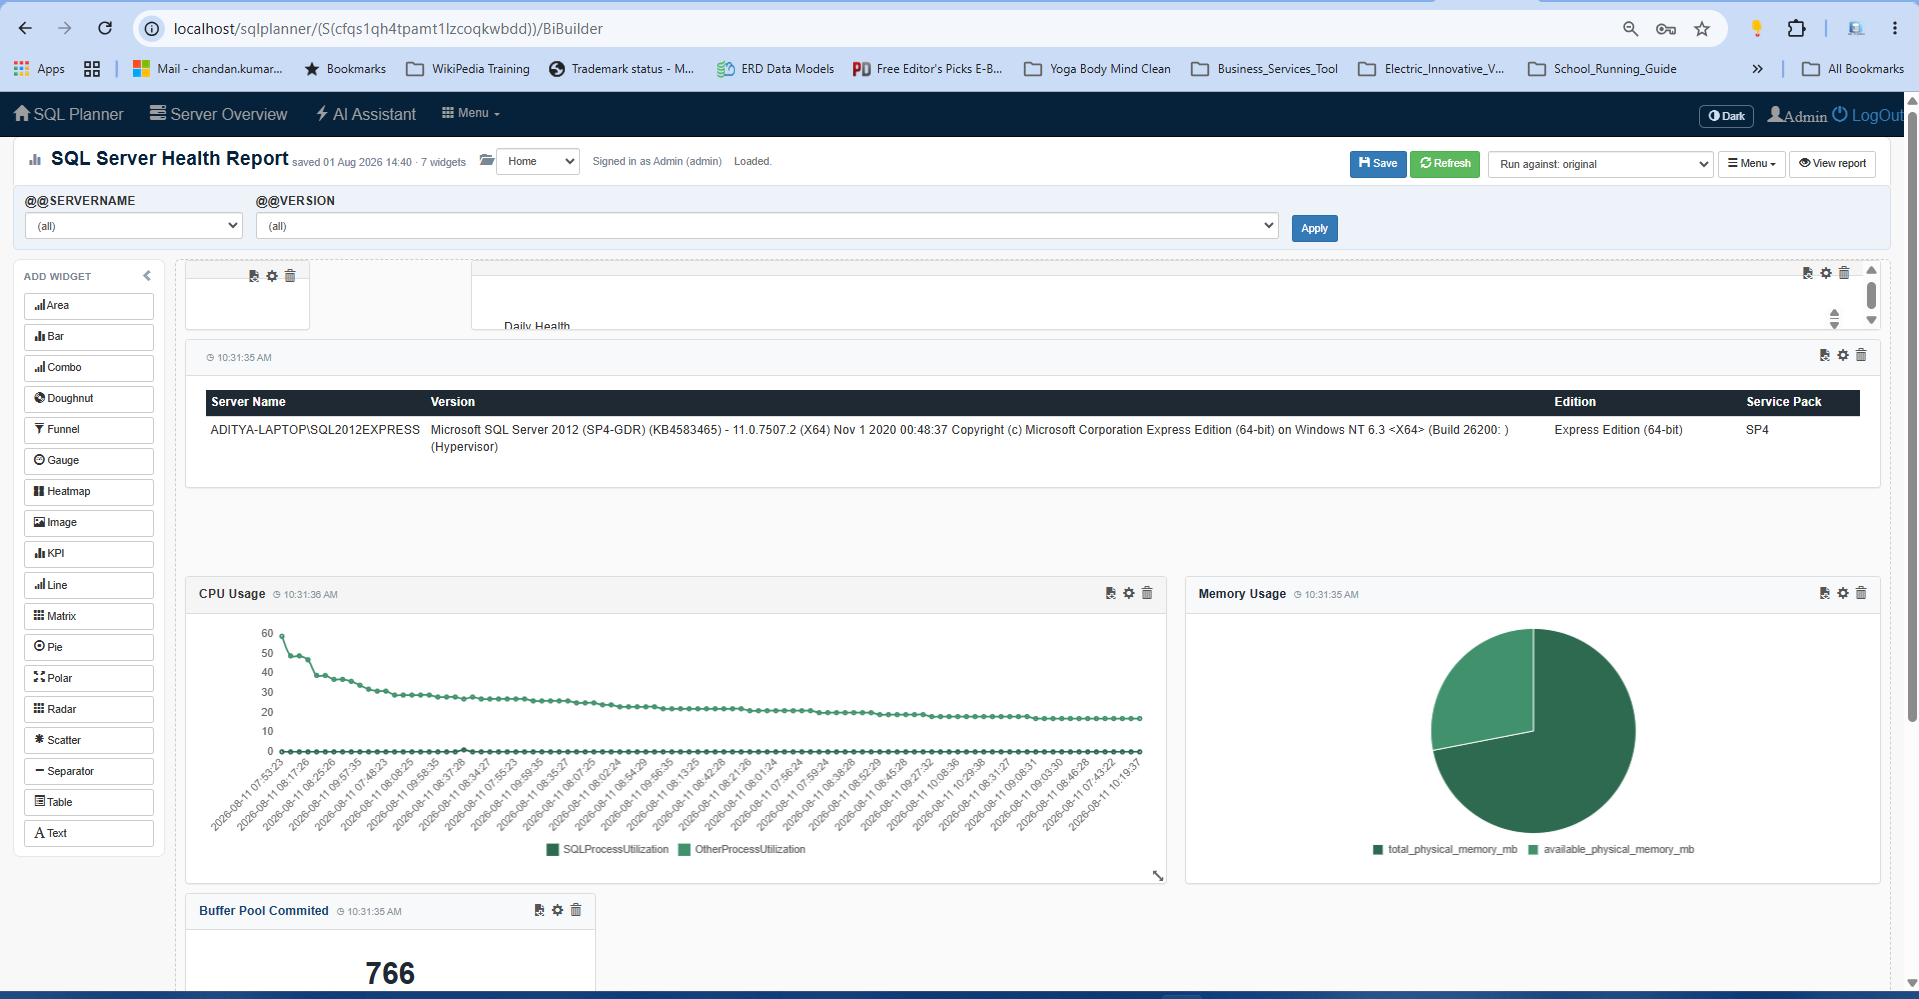
Everything you need to build and share reports
Rich visuals
Ten-plus widget types, each from a single query.
- Bar, line, area & scatter
- Pie, doughnut, polar & radar
- Data tables with conditional formatting
- Pivot matrix & big-number KPIs
Parameters & filters
Let viewers slice the whole report themselves.
- Single and multi-select pickers
- Dropdowns filled from your database
- Filter, sort & Top-N per widget
- Click-to-cross-filter across widgets
Shared datasets
Write a query once and reuse it everywhere.
- Named, connection-bound queries
- Swap a widget to a dataset in one click
- Update centrally, every report follows
Pivot matrix
Cross-tab any result into rows and columns.
- Multi-level row groups
- Column headers from your data
- Sum, count, average, min or max
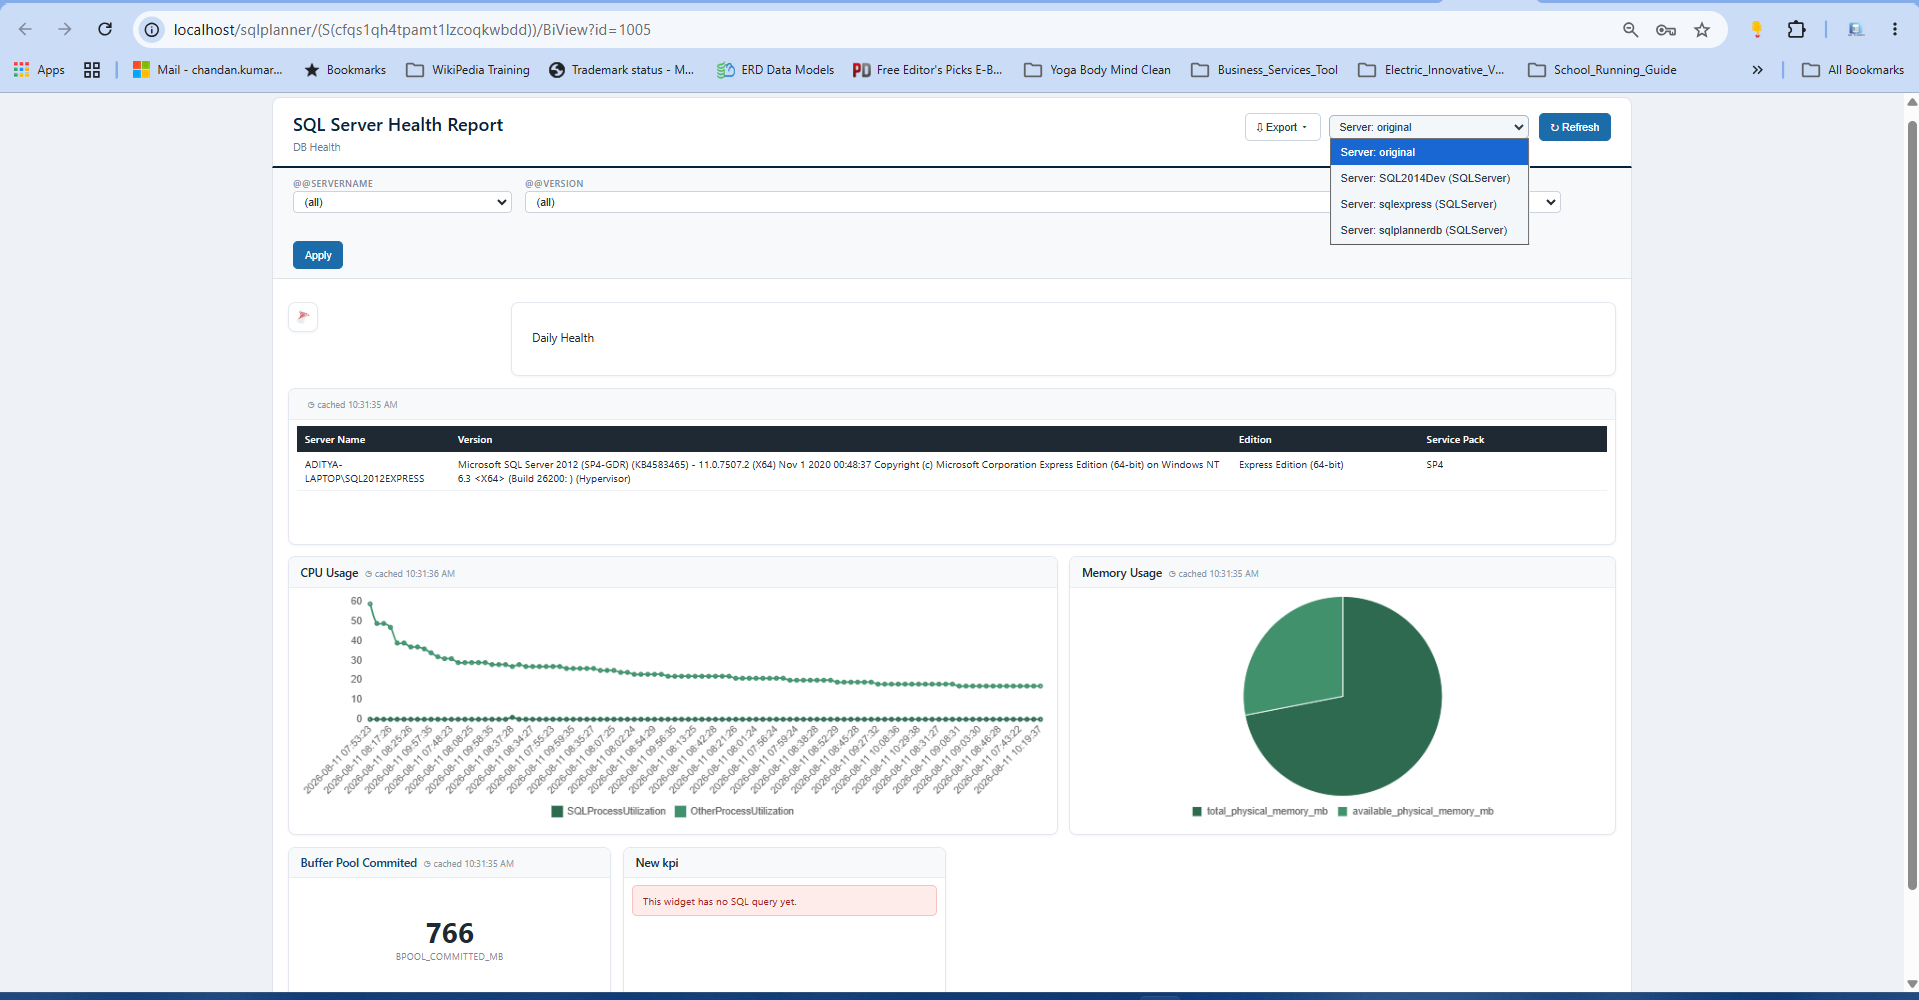
Multi-server runs
One report, pointed anywhere you need.
- "Run against" any connection on the fly
- Same query, different server
- Perfect for health checks across estates
Export & embed
Get the numbers out in the format people want.
- Excel, CSV, PDF & PNG
- Clean read-only viewer
- Cached for fast repeat loads
Keep reports tidy — and in the right hands
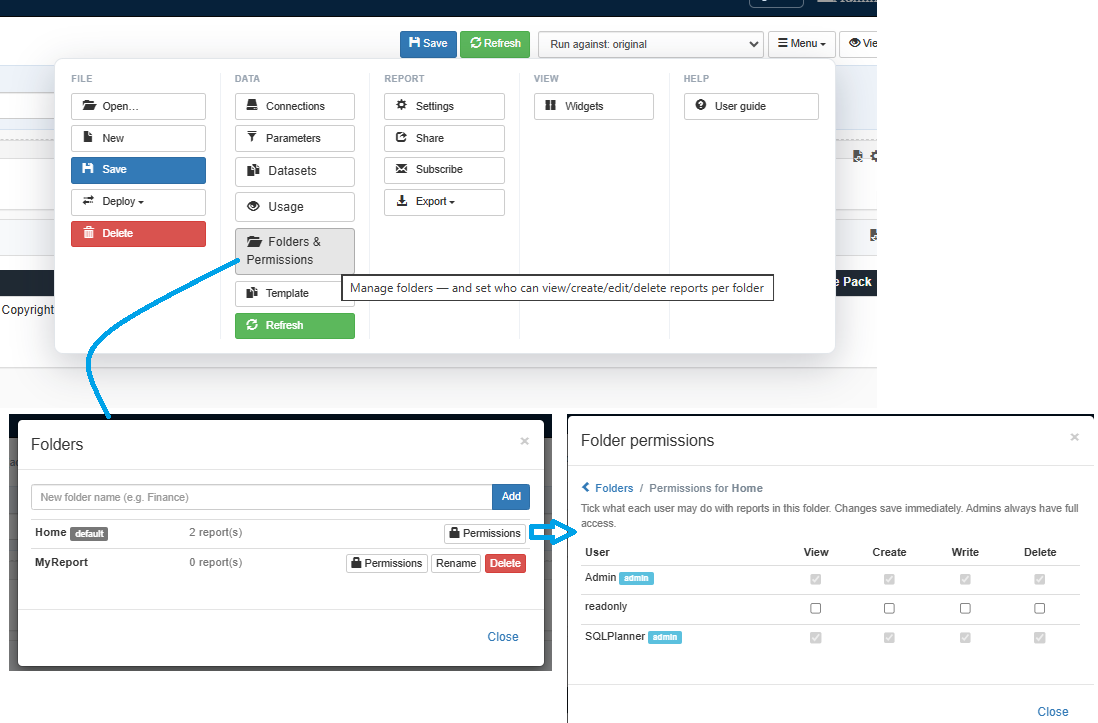
Folders & permissions
Group reports into folders and decide, per user and per folder, who can view, create, edit or delete. Owners keep control of their own work; admins see everything.
- Per-folder access grid
- Move reports between folders
- Card-based report browser
Share & schedule
Send a report to people who never open the builder. Create a view-only link (optionally passcode-protected), or schedule email delivery so the numbers arrive on their own.
- Link sharing, no sign-in needed
- Recurring email subscriptions
- Duplicate & export/import as templates
Three steps to a shared dashboard
Connect & query
Point a widget at a connection and write plain SQL — or reuse a shared dataset. Parameters go in as @Name.
Design the report
Pick chart types, arrange widgets on the canvas, add filters and a pivot or KPI, and set the theme and row limits.
Share & schedule
File it in a folder, grant access, publish a link or schedule email — and run it against any server whenever you need.
The complete feature set
Put your databases to work
Build your first dashboard in minutes and share it with the people who need the numbers — no separate BI platform required.
Read the user guide