
SQL Server · PostgreSQL · MySQL · Oracle
Stop guessing. See exactly which SQL is waiting — and why.
SQL Planner samples every active session once a second and turns it into wait-time analysis your whole team can read: which statement, which wait, which minute. One console for all four database engines, on-premise or in any cloud.
No agents on your servers · Read-only access · Setup in minutes
Why wait-time analysis
Server health charts tell you something is wrong. They never tell you what to fix.
CPU at 90% is a symptom. Wait-time analysis measures where your queries actually spend their time, ranked by the one number that matters to users: how long they waited.
Find the real bottleneck
Every second of waiting is attributed to a category — disk, locking, memory, network, parallelism, log — so you argue from measurement, not instinct.
Rank by user impact
The top 50 waiting statements are ordered by total wait time, so the query hurting people most is always at the top of the list.
Prove the fix worked
Compare the same window before and after a change. The wait profile either dropped or it didn't — no interpretation required.
Features
From a fleet-wide chart to a single line of SQL, in three clicks.
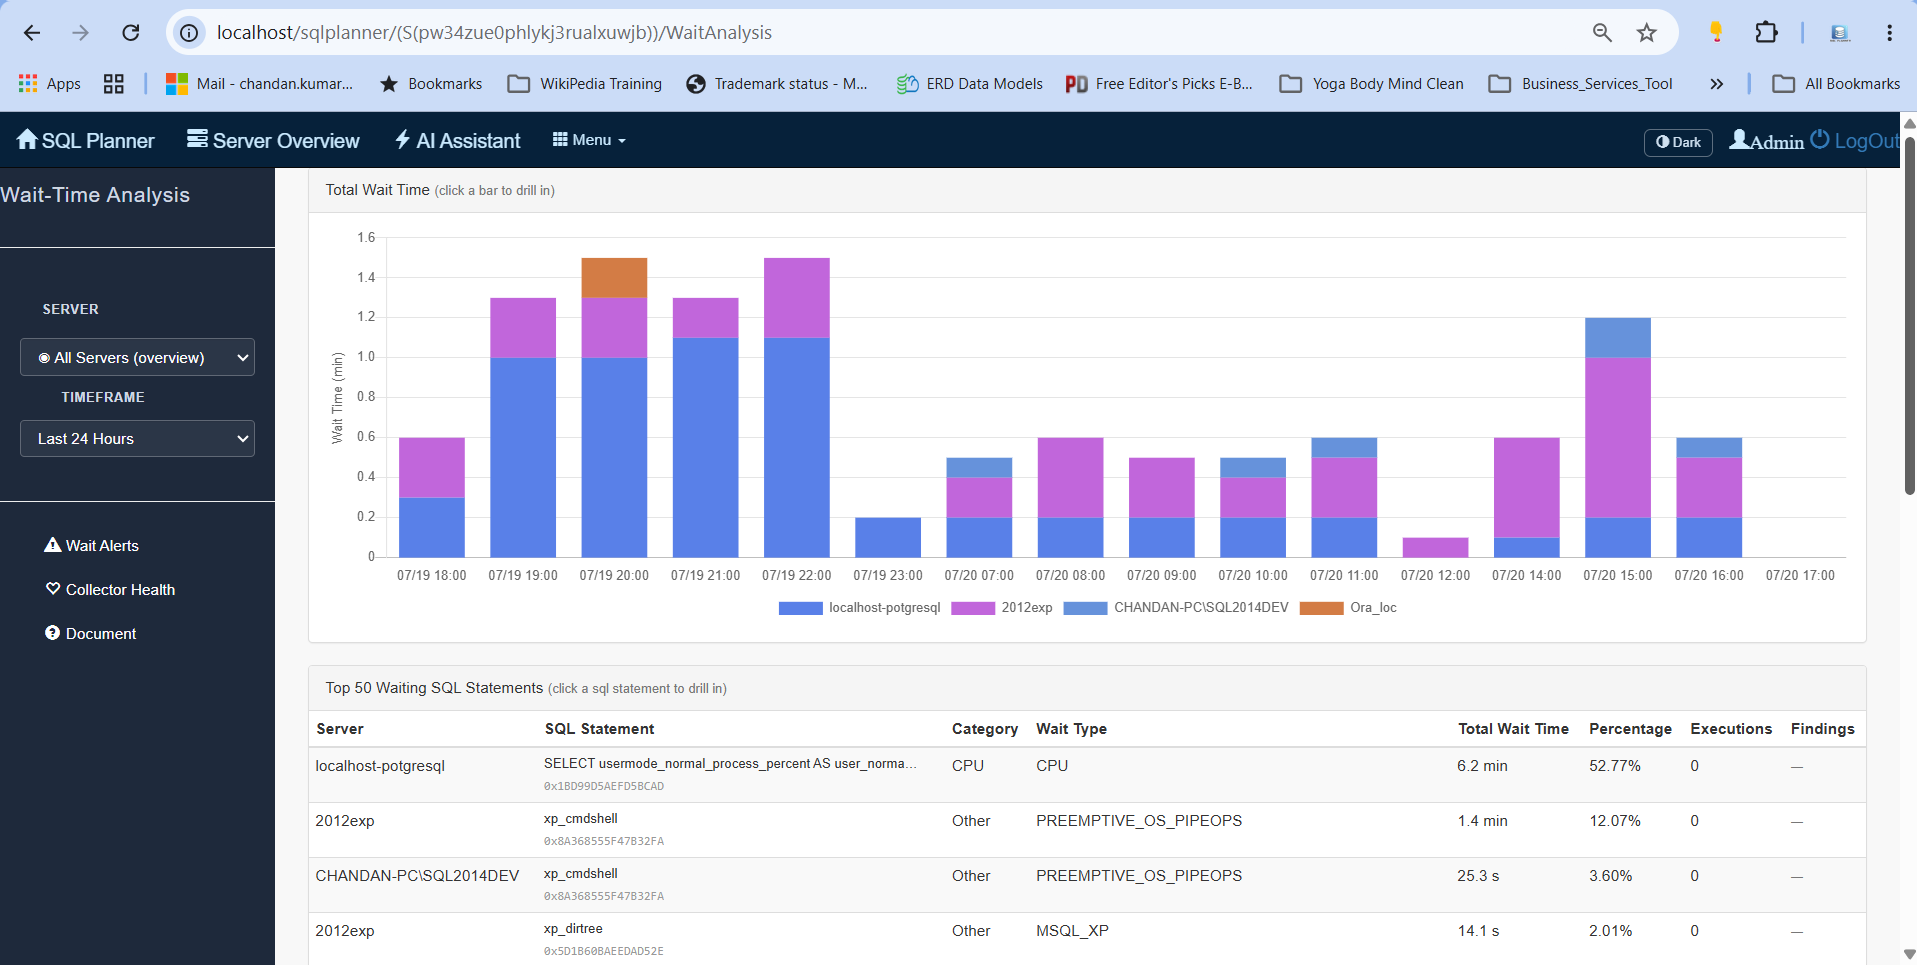
Wait analysis dashboard
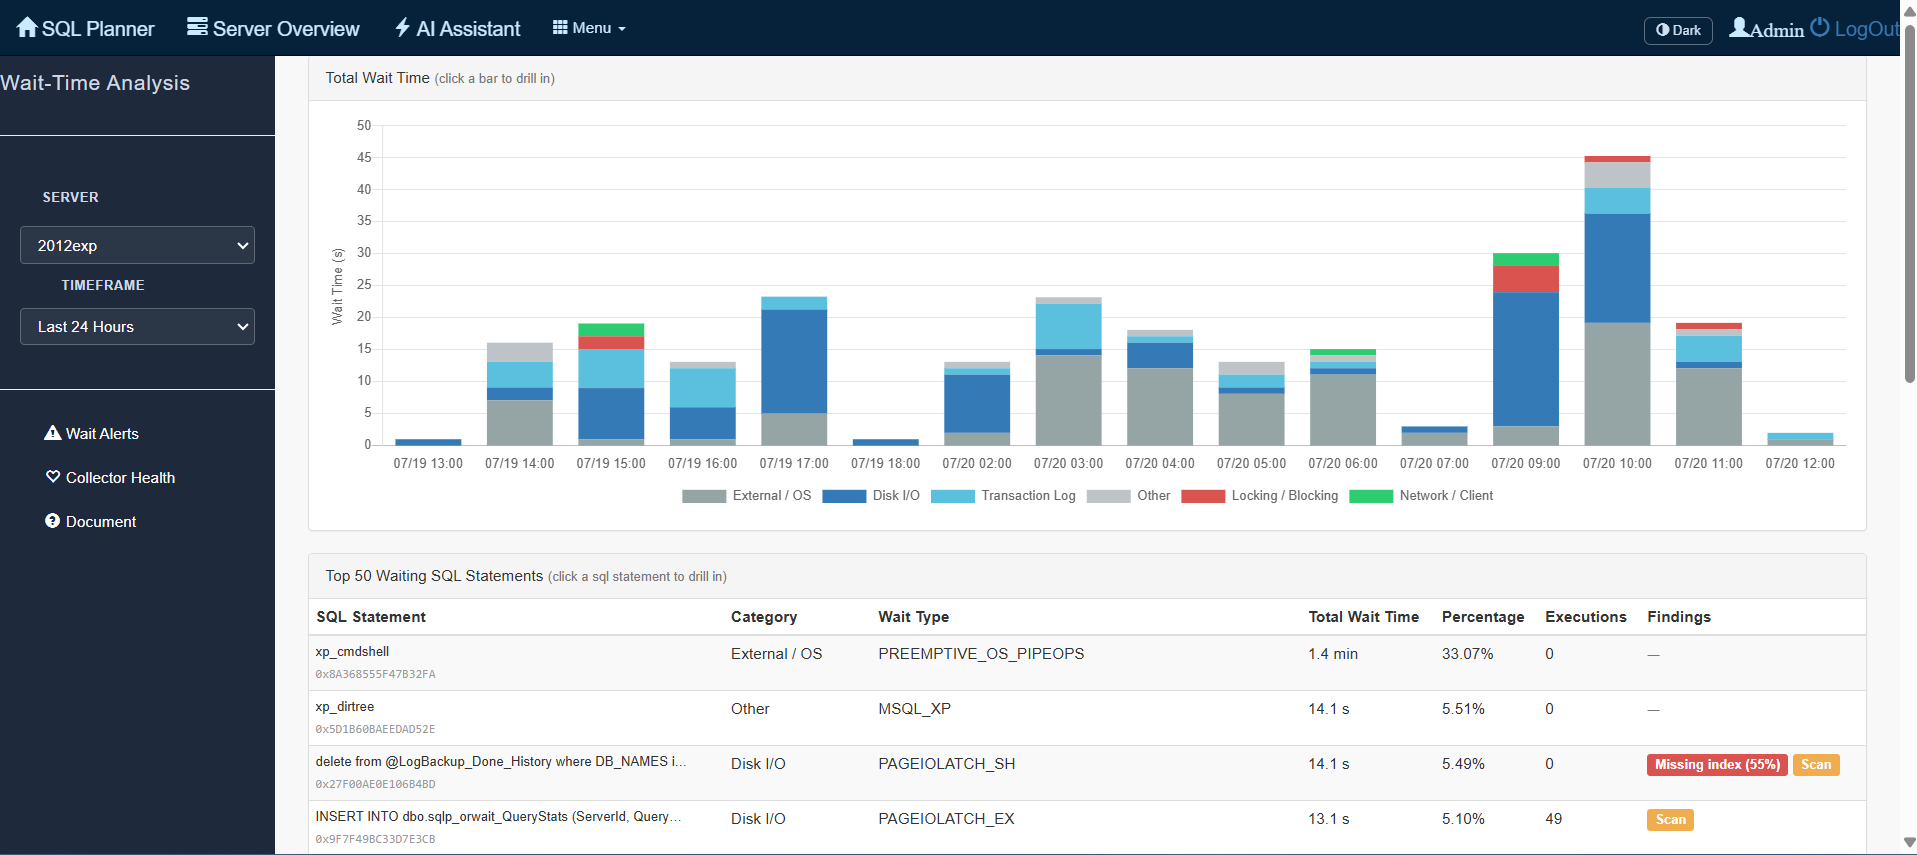
One stacked chart for every server you monitor, whatever the engine. Click a bar to drill from a day, into an hour, into a five-minute slice — the statement list narrows with you.
- All four engines on a single fleet-wide chart
- Drill down: day → hour → 5 minutes
- Click any legend entry to filter a server or a wait category out
- Each server displays in its own time zone; data is always stored in UTC
- Job and deadlock markers overlaid on the timeline
Click to Enlarge
Query Advisor
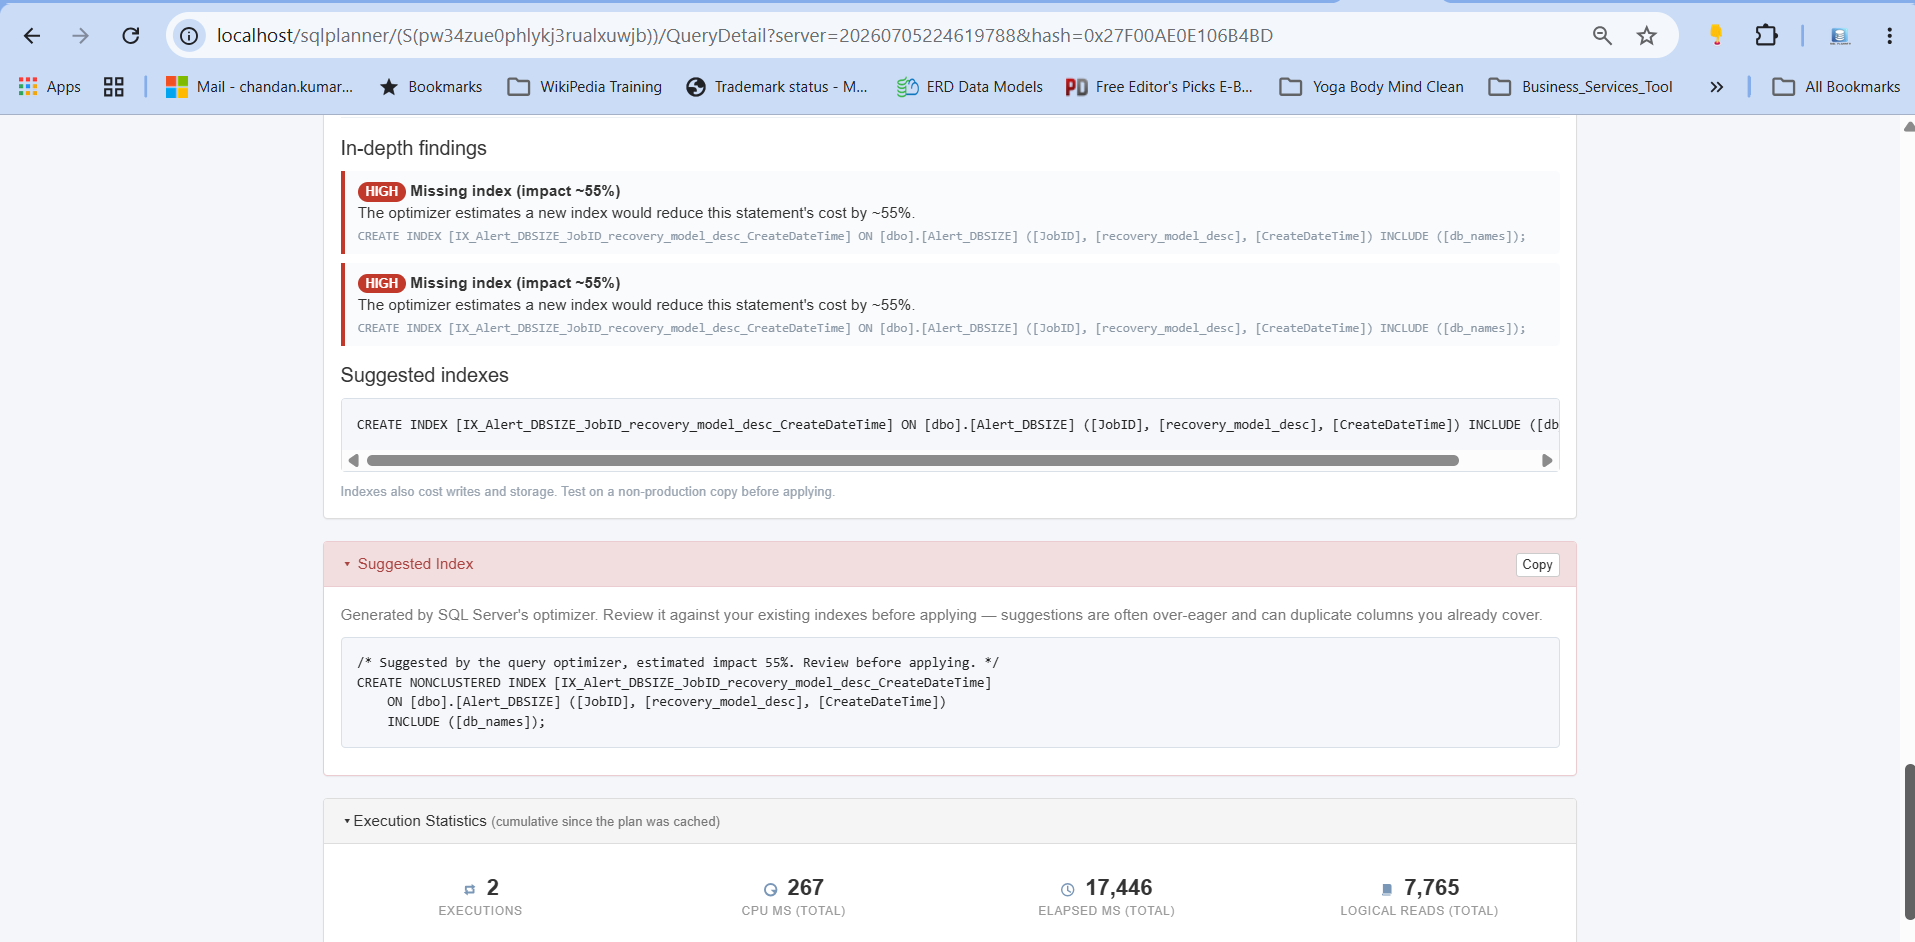
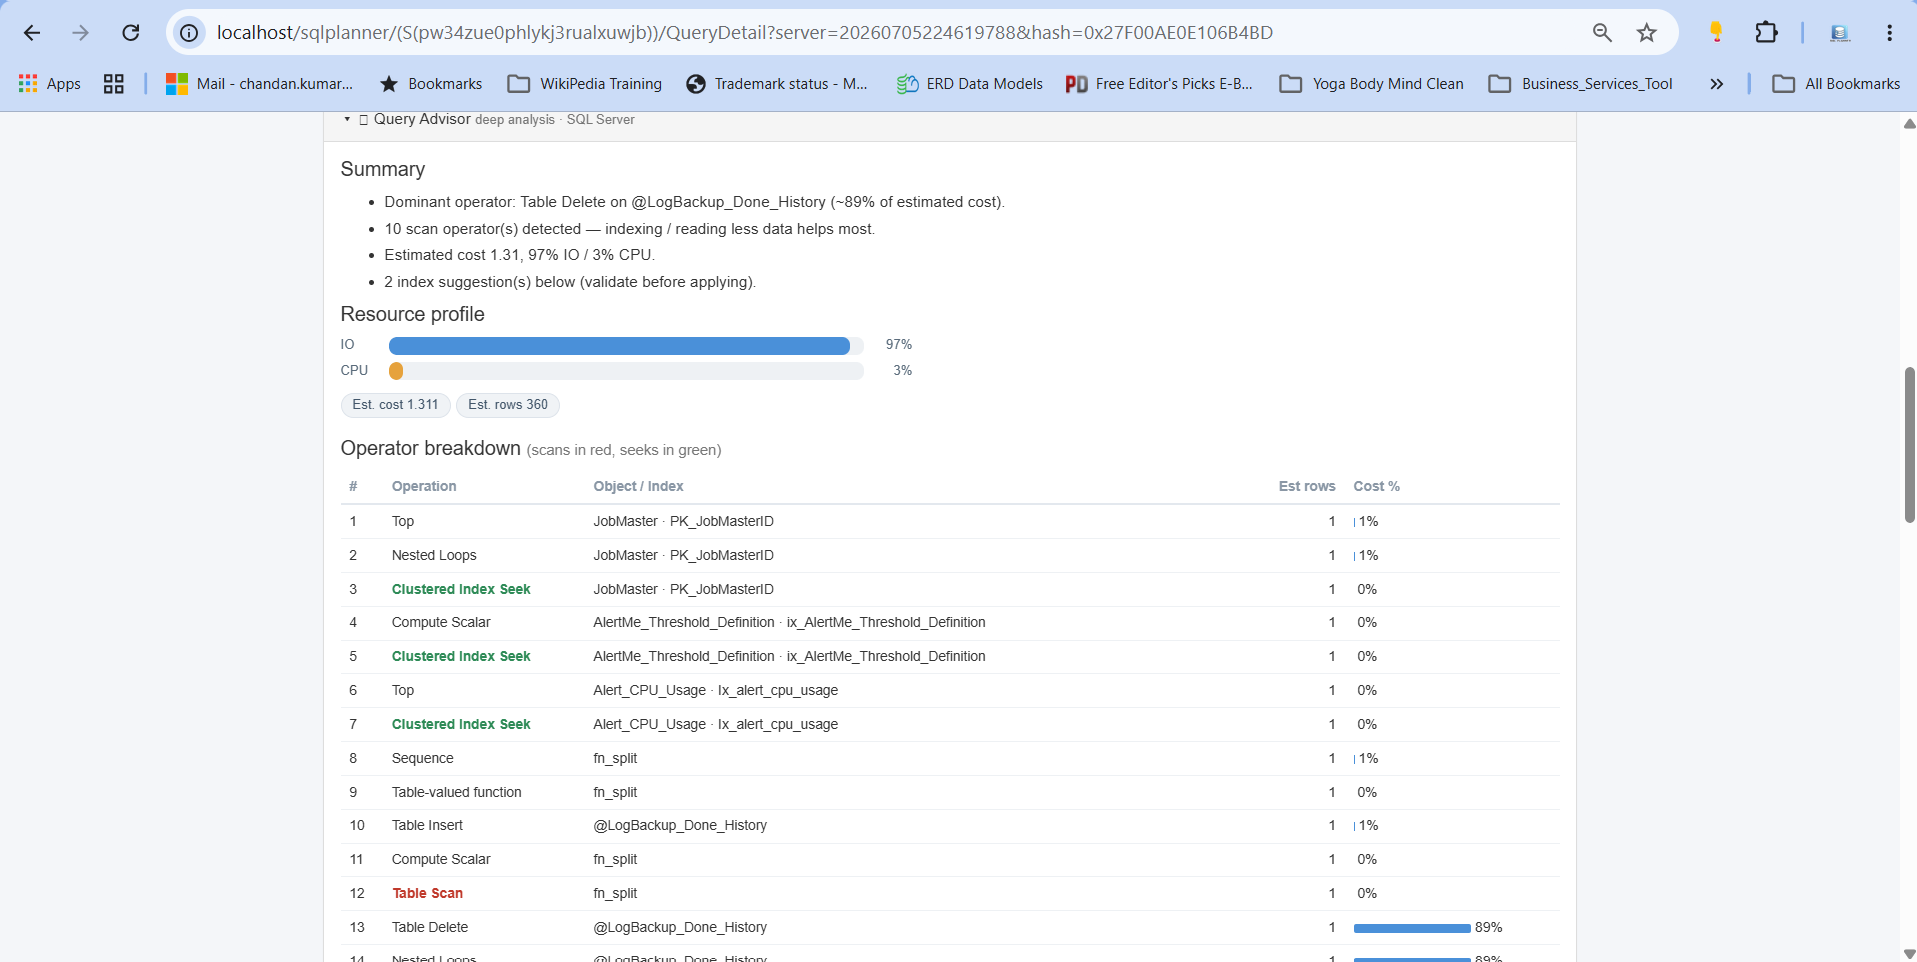
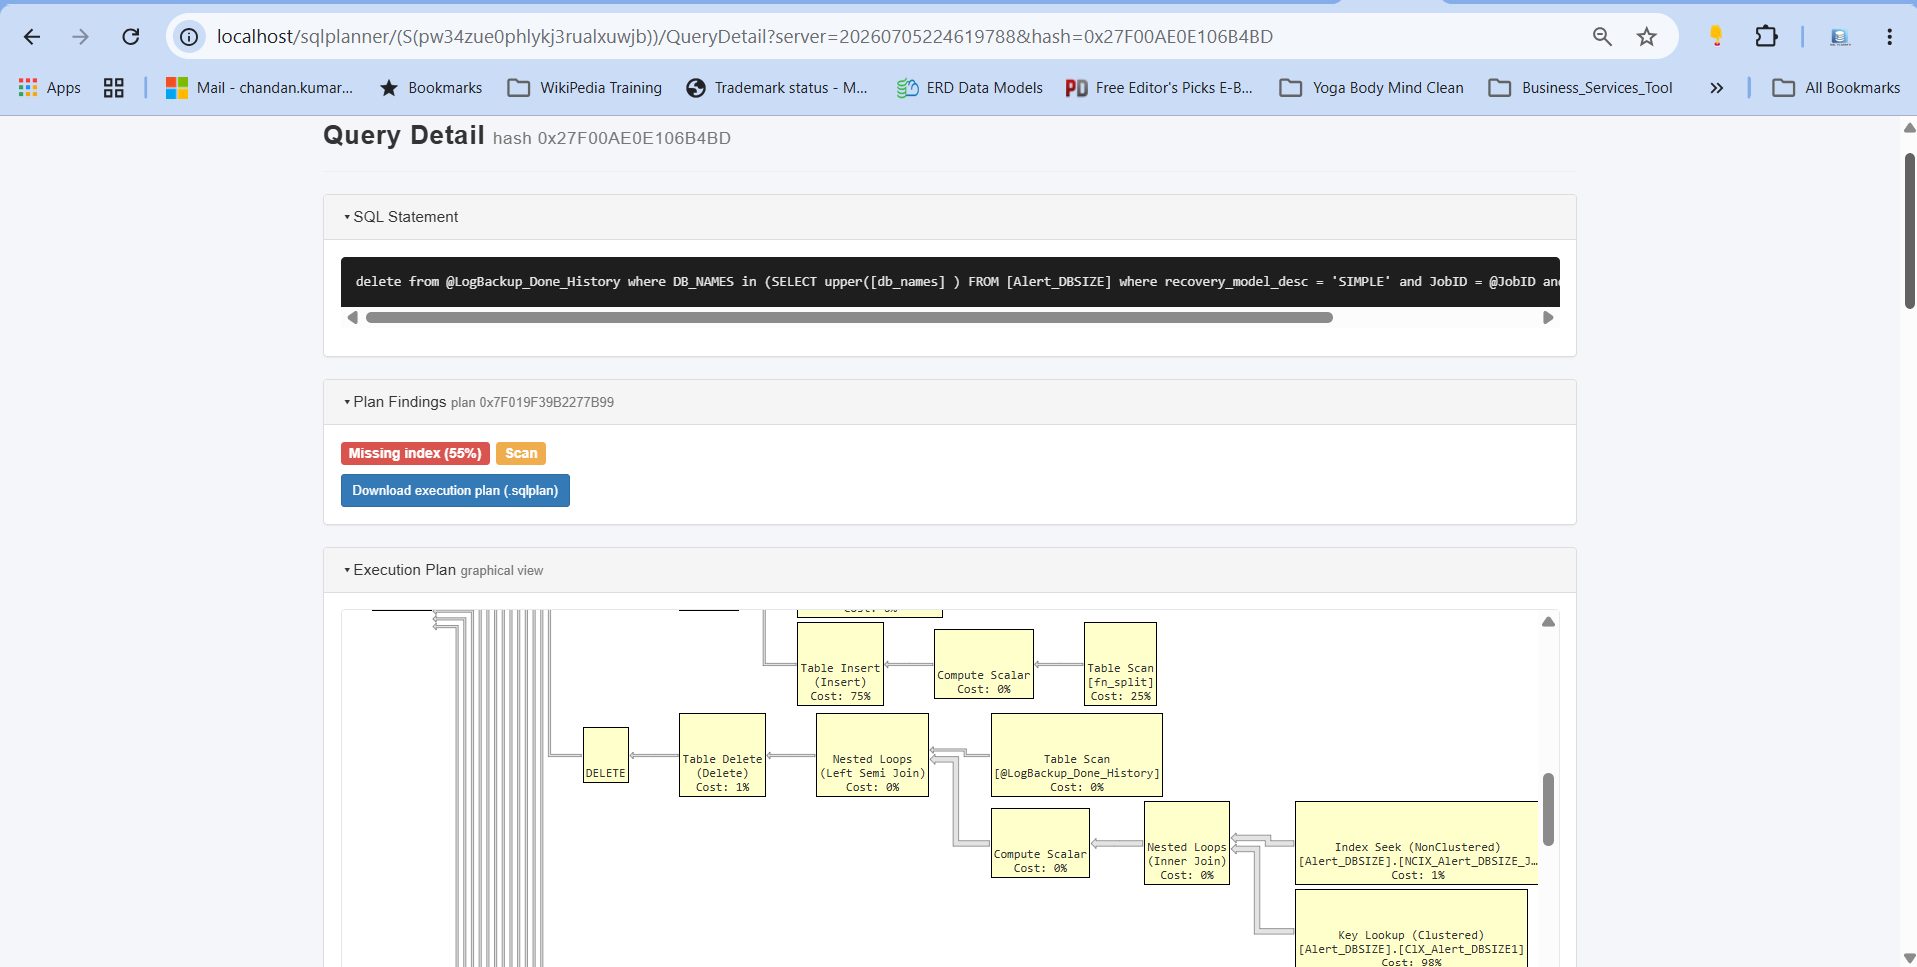
Open any waiting statement and SQL Planner reads its execution plan for you — in the dialect of that engine — then says plainly what is wrong and what to try.
- Plain-language findings graded high, medium and informational
- Resource profile: how much of the plan's cost is I/O versus CPU versus memory
- Operator breakdown with scans flagged red and seeks green
- Index suggestions with the CREATE INDEX statement written out
- Rewrite suggestions where the SQL itself is the problem
Click to Enlarge
Graphical execution plans for every engine
SQL Server plans render the way you already know them. PostgreSQL, MySQL and Oracle plans get the same treatment — a real operator tree, not a wall of text.
- Cost-weighted operator tree with scans and seeks colour-coded
- Hover any node for row estimates, object and cost share
- Download the original .sqlplan for SQL Server
- Plans captured with a non-executing EXPLAIN — your statement never runs twice
How it works
A sampler, a repository, a dashboard. Nothing installed on your database servers.
SQL Planner connects the way any other client would, reads the session and statistics views your engine already publishes, and writes the results to its own repository.
Built for the people who run it
The unglamorous parts, done properly.
Least-privilege by design
A built-in wizard writes the exact CREATE USER and GRANT statements for your engine and hosting. Run them yourself, or let SQL Planner run them once with an admin login it never stores.
Encrypted credentials, per-server TLS
Passwords are encrypted at rest. Every server chooses its own SSL mode — none, required, or full certificate verification — and the collector honours the same setting.
Collector health you can see
A live page shows every server's last sample, hourly coverage and last error — so a collector that quietly stopped can't hide from you.
Tested before it's saved
Adding a server runs a real connection test with that engine's own driver and checks it can read the monitoring views. A server that can't be monitored never gets saved.
Retention that manages itself
Per-second samples roll up to the minute, then to the hour, then age out on a schedule you set. The repository stays fast without a maintenance ritual.
Runs on your infrastructure
An ASP.NET web console and a Windows collector service, with a SQL Server repository. Your telemetry never leaves your network.
Complete feature list
Everything in SQL Planner
Coverage
- Microsoft SQL Server — 2012 through 2022, Express to Enterprise
- PostgreSQL — 10 and later, including Aurora PostgreSQL
- MySQL — 5.7 and 8.x, including Aurora MySQL and MariaDB-compatible builds
- Oracle — 11g through 23c, including XE and pluggable databases
- On-premise — physical, virtual and containerised instances
- Microsoft Azure — SQL Database, SQL Managed Instance, Database for PostgreSQL and MySQL
- Amazon Web Services — RDS and Aurora for all four engines
- Google Cloud — Cloud SQL for PostgreSQL and MySQL
- Oracle Cloud — OCI database services
Wait-time analysis
- One-second sampling of every active session, all day
- Wait categories — CPU, disk I/O, locking and blocking, memory, network, parallelism, transaction log, buffer latch, high availability
- Engine-native classification — each engine's own wait vocabulary mapped to one shared taxonomy
- Fleet overview — every server and engine on one stacked chart
- Per-server view — the same window broken down by wait category
- Drill-down — day, hour, then five-minute resolution
- Top 50 waiting statements for whatever window you're looking at
- Legend filtering — strike out a server or category and the list follows
- Per-server time zones for display; UTC everywhere in storage
- Scheduled-job markers drawn on the timeline
Query intelligence
- Full statement text captured and fingerprinted per query
- Execution counts — from SQL Server DMVs, PostgreSQL
pg_stat_statementsand Oraclev$sqlstats - Execution statistics — CPU, elapsed time, logical reads and rows, total and per execution
- Automatic plan capture using a non-executing EXPLAIN, once per statement
- Graphical plan trees for every engine, cost-weighted and colour-coded
- Query Advisor findings — scans, nested loops, sorts, implicit conversions, key lookups
- Index suggestions with ready-to-run DDL
- Rewrite suggestions where the statement itself is the problem
- Deadlock analysis with victim and resource detail
Deployment and security
- Agentless — nothing installed on a monitored server
- Read-only monitoring account — VIEW SERVER STATE, pg_monitor, PROCESS, or SELECT_CATALOG_ROLE
- Monitoring-user wizard — generates and optionally runs the GRANT script for your engine and cloud
- Connection test before save, using each engine's own driver
- Per-server TLS — none, required, preferred or verify-CA
- Windows authentication supported for SQL Server
- Encrypted credential storage in the repository
- Flexible Oracle connections — service name, SID, Easy Connect, TNS alias or a full descriptor
- Self-hosted — ASP.NET console, Windows collector, SQL Server repository
- Automatic retention — minute and hour rollups, scheduled pruning
Questions
Frequently asked questions
What is database wait-time analysis?
Wait-time analysis measures how long your database sessions spend waiting, and on what. Instead of reporting that CPU is busy or disks are slow, it attributes every second of delay to a specific SQL statement and a specific wait category — disk I/O, locking, memory, network and so on. Because it measures the delay users actually experience, it ranks work by real impact rather than by server-level symptoms.
Which databases and platforms does SQL Planner support?
SQL Server 2012–2022, PostgreSQL 10 and later, MySQL 5.7 and 8.x, and Oracle 11g–23c. Each is supported on-premise and on managed cloud services including Azure SQL Database and Managed Instance, Amazon RDS and Aurora, Google Cloud SQL, and Oracle Cloud. All four engines appear together in one console.
Do I need to install an agent on my database servers?
No. SQL Planner connects over the network like any other client and reads the session and statistics views your database already publishes. Nothing is installed on a monitored server, which is why it works unchanged on managed cloud services where you cannot install software.
What permissions does the monitoring user need?
Read-only rights, and nothing more: VIEW SERVER STATE on SQL Server, the pg_monitor role on PostgreSQL, PROCESS plus SELECT on performance_schema for MySQL, and SELECT_CATALOG_ROLE on Oracle. No access to your application tables is granted. A built-in wizard generates the exact statements for your engine and hosting, and can run them for you.
How much load does monitoring add to the database?
Very little. Each sample is a single indexed read of a session view once a second, and results are buffered in memory and written once a minute. Execution plans are captured with a plain EXPLAIN, which asks the optimiser for a plan without running the statement, and each statement is captured only once. In steady state, plan capture stops entirely until a new statement shape appears.
Where is my data stored?
In a SQL Server repository that you own, on your own network. SQL Planner is self-hosted — an ASP.NET web console and a Windows collector service. No telemetry leaves your environment.
See your own wait time this week.
Point SQL Planner at one database and you'll have a wait profile within the hour. No agents, read-only access, and it runs on your infrastructure.




