SQL Planner provides comprehensive alerting capabilities for Windows server monitoring, ensuring administrators receive immediate notifications when critical issues arise. This guide explores the complete alerting system, from email notifications to dashboard displays, and walks through configuration options for customizing alerts to match your organization’s specific needs.
Understanding Historical Server Alerts
The dual delivery system—email plus dashboard storage—ensures redundancy and reliability. Administrators can configure their email settings to receive alerts at specific intervals or immediately upon detection, depending on their operational requirements and urgency levels.
Server Down Alert Notifications
When a server goes down, SQL Planner generates a comprehensive alert email with immediate visibility into the issue. The subject line clearly identifies which server experienced the outage, making it easy to prioritize responses when managing multiple servers.
- Email Subject Line: Clear identification of affected server and alert type.
- Timestamp Details: Precise date and time when alert was detected.
- Error Description: Specific error type and technical details.
The most common server down alert indicates a ping failure, where the monitoring system cannot establish basic network connectivity with the target server. This type of alert appears in both the email notification and the dashboard’s alert history section, providing consistent information across all access points.
Disk Storage Alert Details
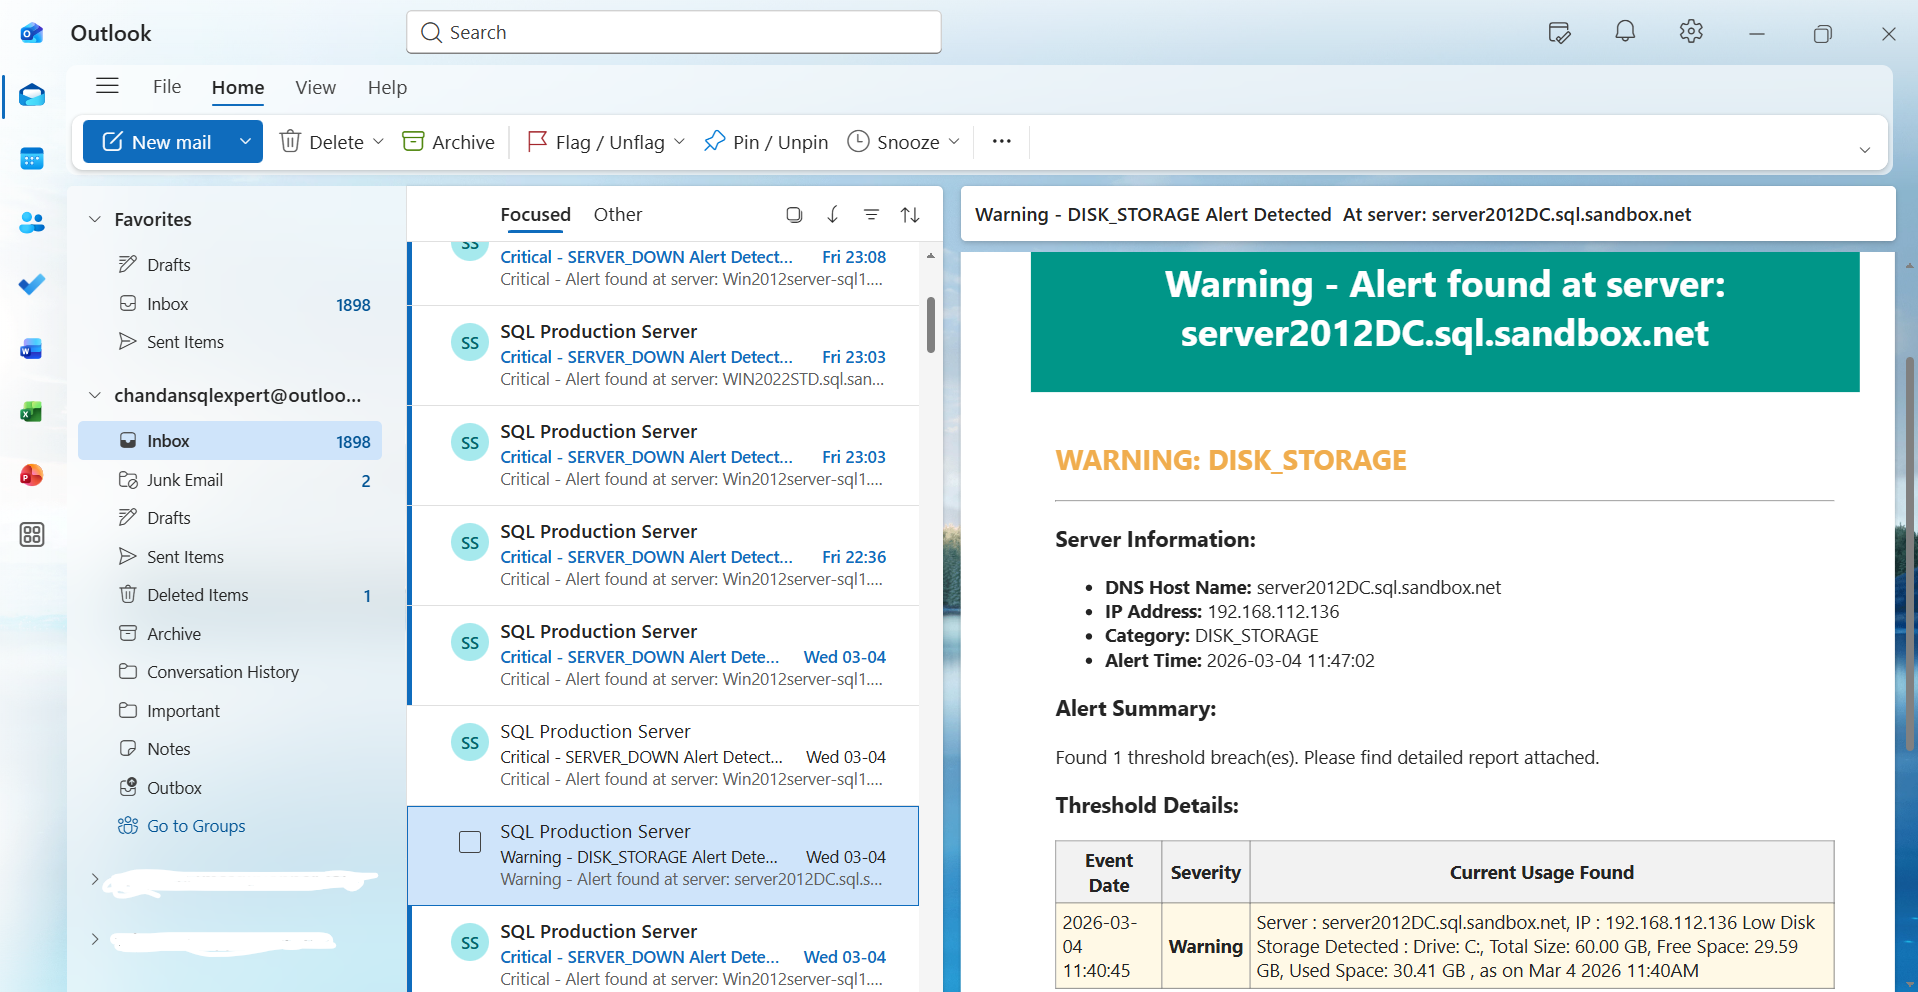
Disk storage alerts provide critical information about server capacity and utilization patterns. When available disk space falls below configured thresholds, the system generates detailed notifications that include the server IP address, current disk load percentage, total volume size, occupied space, and precise timestamp of detection.
| Metric | Description |
|---|---|
| 100% Total Volume Size | Complete capacity of the monitored disk drive. |
| 75% Occupied Space | Current usage percentage triggering the alert. |
| 25% Free Space | Remaining available capacity for operations. |
These storage warnings appear as email notifications with complete technical details and are simultaneously recorded in the dashboard alert history. The system captures data at specific date and time intervals, enabling proactive storage management to prevent critical outages due to full disk conditions.
Service-Specific Critical Alerts
IIS Service | Windows Service Down Example
When critical services such as Internet Information Services (IIS) Or Service fail, SQL Planner generates distinct critical error notifications. These alerts identify which specific service has stopped functioning, the exact server where the failure occurred, and the precise timestamp when the service became unavailable.
The email notification includes detailed service status information, showing which particular IS service instances were affected. If multiple IIS services stop running simultaneously, the system generates separate alerts for each failure, providing granular visibility into the scope of the problem.
Dashboard Integration
All service-specific alerts appear in the dashboard alongside server-level alerts, creating a unified view of system health. The interface clearly distinguishes between warning and critical severity levels, helping administrators prioritize their response efforts.
Service monitoring provides visibility beyond basic connectivity checks. While a server may remain pingable and responsive at the network level, critical services might fail independently. These alerts ensure notification when essential applications, web servers, or database engines stop functioning.
Dashboard Alert Management Interface
The system displays the complete timeline from when a threshold was first breached through resolution or ongoing status. This provides better visibility than email alone, helping identify recurring issues that might indicate deeper systemic problems.
Server Health Report Overview
The health report interface is specifically designed to show comprehensive health reports. When you examine a server with active alerts, it displays summary-level info plus detailed descriptions explaining why specific issues occurred.
- Alert Category Identification: Clear identification of triggered alert type (server down, disk, service failure, etc.).
- Technical Description: Detailed explanation of the underlying technical cause and error conditions detected.
- Historical Context: Previous occurrences showing pattern recognition and recurrence frequency.
Configuring Server Alert Thresholds
By default, all major categories are enabled. Configuration changes apply in real-time, so administrators should test threshold values before deploying to production to avoid false positives.
Custom Service Monitoring Configuration
Navigate to the specific server where you want to add custom monitoring.
Find the service monitoring configuration section within alert settings.
Enter the exact name of the service as it appears in Windows Service Manager.
Confirm it appears in the list and click “Save All Changes”.
The system includes a predefined set of critical services but allows for specialized organization-specific services. This flexibility ensures the monitoring system adapts to your unique infrastructure rather than forcing you to conform to predefined templates.
Getting Started with SQL Planner
Visit mssqlplanner.com to access the free enterprise edition without licensing restrictions.
Download the license activator generator tool and follow provided activation instructions.
Access comprehensive guidance covering installation, configuration, and maintenance.
The enterprise edition includes all alerting features described in this guide. While professional services are available, most administrators can deploy and configure the system independently using the provided documentation.


