Diagnosing High CPU and Memory Consumption
Understanding and troubleshooting resource consumption issues in environments is a critical skill for database administrators and IT professionals. This guide walks through a real-world scenario where a server experiences performance degradation due to excessive CPU or memory usage during specific time periods. When management, developers, or customers report that “something is slowing down on the server,” your investigation begins with systematic analysis using server monitoring tools.
The Server Monitoring Dashboard
The monitoring interface presents a clear overview of your server infrastructure. In the example scenario, three servers appear in the monitoring dashboard, each representing different roles within the virtual machine setup. One server functions as a domain controller, another serves as a general-purpose server, and a third remains powered down. This setup demonstrates how the monitoring system can track servers regardless of their operational state.
Identifying the Problem Server
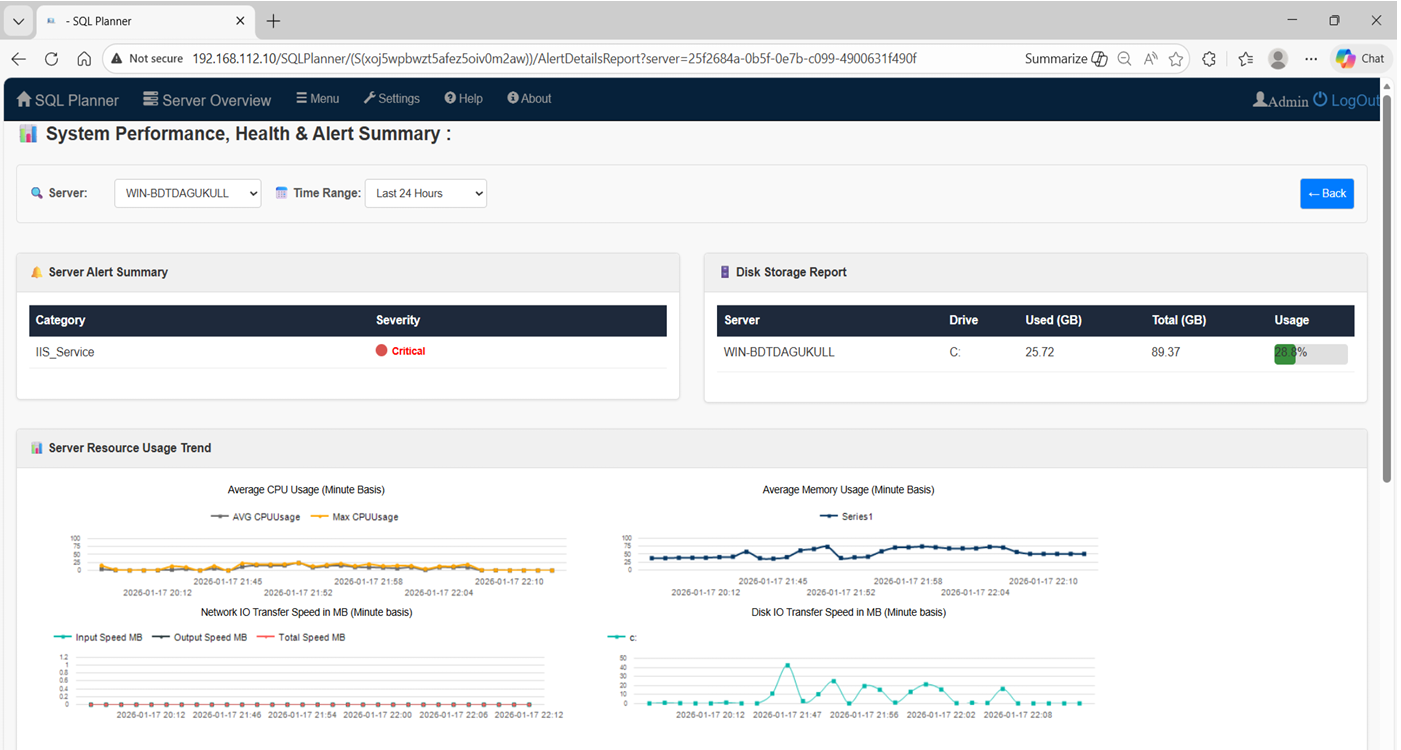
Upon logging into the server overview, the monitoring system immediately reveals that the 2022 server displays a critical offline status. This visual alert serves as the starting point for your investigation. The main focus centers on identifying which particular process consumed the highest amount of CPU resources during the reported performance degradation period.
Analyzing Process-Level Resource Consumption
Below the high-level resource graphs, the monitoring dashboard provides detailed analytical reports that break down resource consumption by individual processes.
| Metric | Description |
|---|---|
| Average CPU Usage | Shows the mean CPU consumption percentage over the selected time period, helping identify processes that consistently tax the processor. |
| Maximum CPU Usage | Reveals peak CPU consumption moments, exposing processes that cause sudden performance spikes and temporary slowdowns. |
| Memory Consumption | Tracks RAM usage patterns, identifying processes that allocate excessive memory or experience memory leaks over time. |
| Network Transfer | Measures data transfer volumes, highlighting processes that generate heavy network traffic and potentially saturate bandwidth. |
Investigating High-CPU Processes
Viewing Process Details
When you identify a process consuming excessive CPU resources, clicking the “View Details” button opens an expanded analysis interface. This detailed view breaks down resource consumption at a finer granularity, typically showing minute-by-minute usage patterns throughout the selected time period.
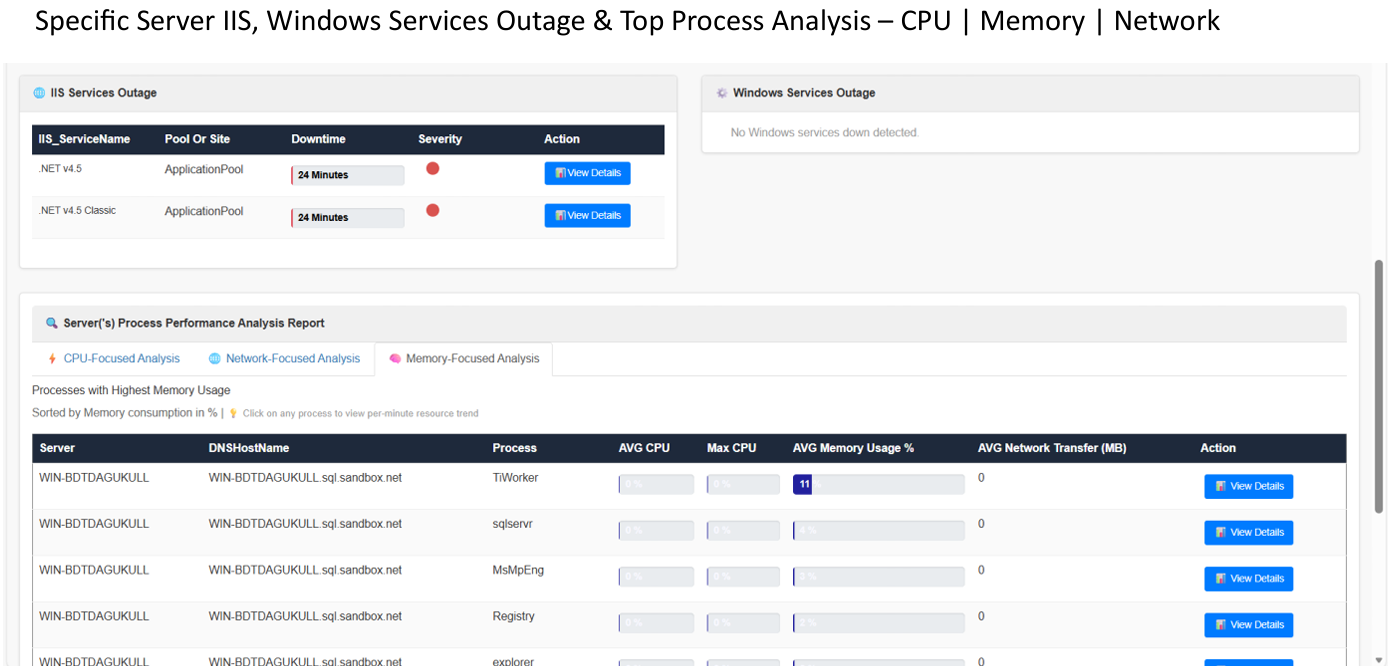
Example Case: The detailed view reveals specific metrics such as average CPU percentage during each minute. For example, the analysis might show that at 23:08 (11:08 PM), a process averaged 12% CPU usage with maximum spikes reaching 12%, while memory usage remained around 5% overall.
Graphical Representation
Visual graphs display CPU and memory usage trends over time, making it easy to spot patterns and correlate resource consumption with reported performance issues. Spikes in the CPU graph align with specific time periods when users experienced slowdowns, creating a clear correlation between process activity and performance degradation.
Understanding Memory Consumption Patterns
Understanding normal versus abnormal memory patterns is crucial for accurate diagnosis. While a SQL Server process consistently using 8GB of RAM represents expected behavior, a process that starts at 100MB and grows to 4GB within an hour indicates a memory leak or inefficient memory management.
Time-Based Analysis for Root Cause Detection
The ability to analyze resource consumption at specific date and minute levels proves invaluable for root cause detection.
- 23:08 – Initial Spike: Process detected at 12% average CPU usage with maximum reaching 12%, memory at 5% overall.
- Correlation Window: Match CPU spikes with user-reported slowdown times to confirm causation.
- Pattern Recognition: Identify recurring patterns across multiple days to determine if the issue is periodic (scheduled task) or random.
Process-Wise Resource Consumption Insights
For example, discovering that a backup utility rather than SQL Server itself causes CPU spikes means you can adjust backup schedules rather than reconfiguring SQL Server settings.
Practical Applications in Daily Operations
Troubleshooting Workflow
Proactive Monitoring Benefits
- Detect resource issues before users experience problems.
- Establish performance baselines for comparison.
- Identify trends indicating future capacity requirements.
- Validate effectiveness of performance optimizations.
Key Takeaways and Best Practices
1. Start with the Dashboard Overview: Always begin troubleshooting by examining the server monitoring dashboard to identify which servers show critical status or resource exhaustion.
2. Use Time-Based Analysis: Correlate user-reported slowdown times with specific minute-level metrics to establish causation.
3. Examine Both CPU and Memory: Check both resource types as issues can stem from either or a combination of both.
4. Understand Normal Patterns: Recognize that SQL Server maintains dedicated memory allocation as expected behavior.
5. Document Findings: Record root cause analyses and remediation steps to build institutional knowledge.


