If you’re not using SQL Server Monitoring then just imagine your data as a bustling metropolis, where information flows like traffic and critical operations hum around the clock. In this dynamic realm, SQL Server acts as the city’s central nervous system, ensuring smooth data flow and efficient processing. But just like any bustling city, performance bottlenecks can emerge, security threats can lurk like hidden alleys, and growth can strain infrastructure like rush hour gridlock. This is where powerful SQL Server monitoring tools come to the rescue, acting as vigilant guardians for your data metropolis.
These specialized tools offer real-time insights into your SQL Server’s health, performance, and security. They identify issues before they impact users, optimize performance for seamless traffic flow, and safeguard your valuable data from lurking threats. By implementing a robust monitoring strategy, you transform from a reactive firefighter to a proactive architect, shaping a resilient and efficient data ecosystem for your metropolis to thrive.
So, if you’re seeking to ensure the smooth operation of your data metropolis, embrace the power of SQL Server monitoring tools. These vigilant guardians stand ready to guide you toward optimal performance, enhanced security, and a scalable future for your valuable data.
Understanding the Importance of SQL Server Monitoring:
SQL Server: The Cornerstone of Data Management
Think of SQL Server as the engine powering your data-driven applications. It stores, retrieves, and processes information, serving as the lifeblood of everything from customer records to financial transactions. Its efficient operation is crucial for:
- Seamless application performance: Users expect instant responses and uninterrupted access to data. SQL Server monitoring helps identify and address performance bottlenecks before they impact user experience.
- Enhanced data security: Sensitive information demands constant vigilance. Monitoring provides real-time insights into potential security threats and suspicious activities, safeguarding your valuable data.
- Scalability for future growth: Data volumes rarely remain static. Monitoring helps anticipate future demands and proactively adjust infrastructure to ensure smooth scaling when your data metropolis expands.
Efficient Monitoring: Your Guardian Angel
Just like a vigilant guardian angel, effective SQL Server monitoring keeps a watchful eye on your database’s health and performance. It empowers you to:
- Proactively identify issues: Nip problems in the bud before they blossom into major outages. Monitoring uncovers potential bottlenecks, sluggish queries, and resource constraints before they impact users.
- Optimize resource utilization: Allocate resources efficiently, ensuring peak performance even during peak loads. Monitoring sheds light on underutilized or overloaded resources, allowing you to fine-tune your configuration for optimal efficiency.
- Maintain robust security: Stay ahead of potential threats. Monitoring flags suspicious activities and security breaches, enabling you to take swift action to protect your data.
By embracing SQL Server monitoring, you transform from a reactive firefighter to a proactive architect, shaping a resilient and efficient data ecosystem.
Benefits of SQL Server Monitoring Tools
Now that we’ve established the critical role of SQL Server monitoring, let’s dive into the specific benefits you can reap by implementing powerful SQL Server monitoring tools.
Reaping the Rewards of Real-time Insights:
- Performance Clarity: Forget the days of blind guessing. Tools unveil detailed metrics on CPU utilization, memory usage, query execution times, and I/O throughput, providing a real-time snapshot of your database’s health.
- Bottleneck Busting: Identify sluggish queries and resource constraints before they become user-crippling bottlenecks. Tools pinpoint performance issues proactively, allowing you to optimize queries and fine-tune resource allocation.
- Trend Tracking: Go beyond the present, track performance trends over time, and anticipate future demands. This foresight empowers you to proactively scale your infrastructure and prevent future bottlenecks.
Proactive Problem Prevention:
- Issue Prediction: Don’t wait for disaster to strike. Tools analyze historical data and current metrics to predict potential issues before they impact users. This allows you to address problems before they even surface, minimizing downtime and ensuring consistent availability.
- Alerting Automation: Receive timely notifications directly on your preferred platforms about critical events, suspicious activities, and performance thresholds. This ensures you’re always in the loop and can take immediate action.
- Root Cause Analysis: Dig deeper than surface symptoms. Tools pinpoint the true root cause of performance issues, helping you effectively address the core problem and prevent its recurrence.
Optimizing Resource Utilization:
- Resource Allocation Efficiency: Identify underutilized or overloaded resources and redistribute them strategically. This optimization avoids resource waste and ensures peak performance even during peak demand.
- Cost Control: By eliminating resource waste, you optimize your infrastructure and potentially reduce server costs. Monitoring ensures you’re only paying for resources you truly need.
- Capacity Planning: Gain insights into future resource demands based on usage trends. This foresight enables you to proactively plan upgrades and expansions, ensuring your infrastructure can support future growth.
Enhanced Security Measures:
- Threat Detection: Monitor critical events and activities to identify suspicious behavior and potential security breaches. This real-time vigilance safeguards your data against unauthorized access and malicious intent.
- Compliance Assurance: Adhere to strict data security regulations with comprehensive logging and auditing capabilities. Monitoring tools provide detailed records of user activity and system events, ensuring compliance and meeting your security requirements.
- Data Breaches Mitigation: React swiftly to security incidents. Tools provide immediate alerts and detailed logs, allowing you to quickly contain data breaches and minimize damage.
Scalability Planning and Management:
- Growth Forecasting: Anticipate future data demands based on usage trends and historical data. This foresight empowers you to proactively scale your infrastructure before encountering bottlenecks.
- Smooth Scaling Transitions: Seamlessly migrate to new hardware or cloud environments, minimizing downtime and ensuring continuous data availability. Monitoring tools offer migration support and performance analysis to ensure a smooth transition.
- Resource Optimization for Scalability: Allocate resources efficiently to support future growth. Monitoring aids in identifying resource demands during peak loads, helping you plan your infrastructure for a scalable future.
Choosing the Right Tool for Server Monitoring Tools:
Now that you understand the benefits, it’s time to pick the perfect tool for your needs. Different tools cater to specific requirements and budgets. Popular options like SQL Server Management Studio (SSMS), SQL Server Performance Dashboard, Quest SQL Optimizer, Idera SQL Monitor, and SolarWinds SQL Sentry offer diverse functionalities. Consider factors like:
- Budget: Free vs. paid tools cater to different budget constraints.
- User Expertise: Choose a tool with a user interface and features aligned with your technical skillset.
- Desired Features: Prioritize features like performance monitoring, query analysis, alerting capabilities, and automation options.
- Database Size and Complexity: Select a tool that scales to accommodate your specific database size and complexity.
Putting theory into practice: Implementing SQL Server Monitoring Strategies
Now that you understand the benefits and have chosen your weapon of choice, let’s delve into the practical implementation of SQL Server monitoring strategies.
Step-by-step Guide to Monitoring Nirvana:
- Define your Monitoring Goals: Identify your key performance indicators (KPIs) and desired outcomes. What are you most concerned about? Performance bottlenecks? Security vulnerabilities? Scalability challenges? Defining clear goals guides your monitoring setup and analysis.
- Tool Configuration and Customization: Dive into the specifics of your chosen tool. Learn its configuration options, customize dashboards to present critical metrics visually, and set up alerts to notify you of anomalies and critical events. Refer to tool-specific documentation or online resources for detailed instructions.
- Establish Alert Thresholds: Define clear thresholds for your chosen KPIs. At what point should CPU utilization trigger an alert? When does query execution time become concerning? Setting appropriate thresholds ensures you receive timely notifications for real issues, avoiding alert fatigue.
- Proactive Monitoring and Analysis: Don’t just set it and forget it! Regularly review monitoring data, analyze trends, and proactively identify potential issues before they manifest. Investigate the root causes of alerts and implement preventative measures to avoid future occurrences.
- Integrate with Workflows: Seamlessly integrate your monitoring system with your existing IT operations and workflows. This ensures quick action when alerts are triggered and facilitates a holistic view of your database health within your broader IT ecosystem.
Tools of the Trade: Configuration and Customization Examples:
- SQL Server Management Studio (SSMS): Utilize built-in performance counters and activity monitoring features. Customize views and alerts to focus on specific aspects of your SQL Server environment.
- Quest SQL Optimizer: Leverage query analysis tools to identify inefficient queries and optimize their execution plans. Configure automated recommendations and set alerts for critical query performance issues.
- Idera SQL Monitor: Visualize server health through customizable dashboards and reports. Set granular alert thresholds for diverse metrics and integrate with other Idera solutions for comprehensive IT monitoring.
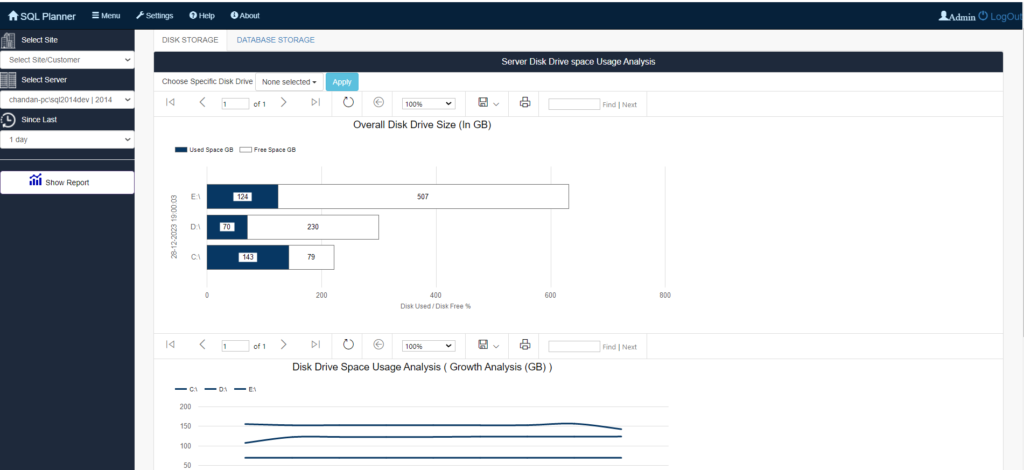
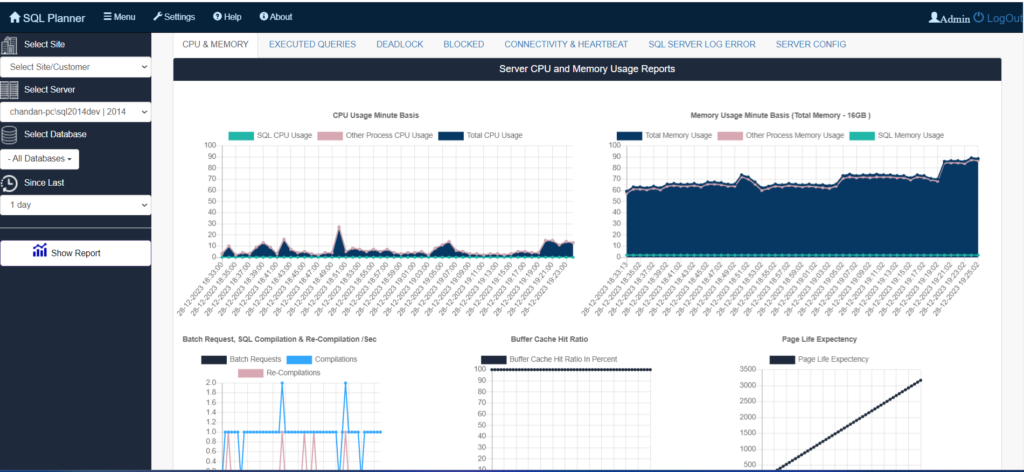
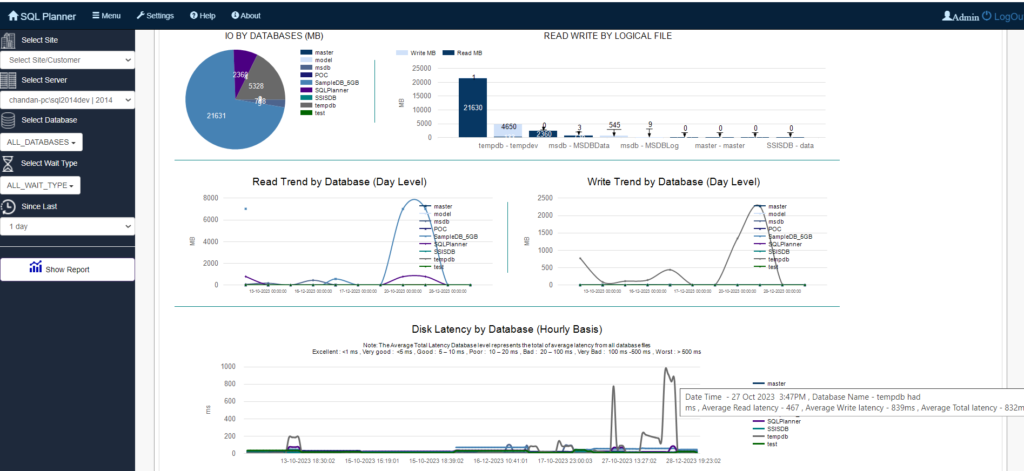
- MSSQL Planner: This web-based tool monitors and backs up your Microsoft SQL Server, pinpointing performance issues and providing in-depth reports for fast resolution. Save money, optimize health, and gain deep server insights – all through your browser.
Best Practices for Ongoing Monitoring:
- Regularly review and update your monitoring strategy: As your database evolves and requirements change, adapt your monitoring accordingly.
- Balance automation with human oversight: Utilize automated alerts and notifications, but don’t rely solely on them. Regularly analyze trends and investigate deeper to understand the full picture.
- Share insights and collaborate: Keep stakeholders informed about the health of your SQL Server and discuss potential issues and optimizations with relevant teams.
- Test and refine your monitoring system: Regularly test your alerts and ensure your monitoring system accurately reflects the state of your database.
Common Challenges and Solutions in SQL Server Monitoring
Even the most robust monitoring systems encounter obstacles. Here’s a guide to addressing common challenges and keeping your SQL Server monitoring on track:
1. Data Overload: Too Much of a Good Thing?
- Challenge: The sheer volume of data can overwhelm, making it difficult to identify critical insights.
- Solutions:
- Prioritize key metrics based on your specific goals.
- Implement data aggregation and filtering techniques.
- Visualize data effectively using dashboards and charts to highlight trends.
2. False Positives: Crying Wolf
- Challenge: Inaccurate alerts can trigger unnecessary panic and resource waste.
- Solutions:
- Fine-tune alert thresholds to reduce false positives.
- Implement baseline performance metrics to distinguish anomalies from normal variations.
- Analyze alert patterns to identify recurring false positives and adjust settings accordingly.
3. Troubleshooting Tips for Common Challenges:
- Missing Data: Verify monitoring tool configuration and ensure proper data collection.
- Inconsistent Metrics: Check for changes in server configuration or workload patterns that might affect metrics.
- Alert Delays: Review alert delivery settings and network connectivity.
- Performance Overhead: Optimize monitoring tool configuration to minimize resource consumption.
Unlocking the Secrets of Metrics: Interpreting SQL Server Monitoring Data
Understanding the language of metrics is crucial for effective decision-making. Here’s a primer:
Key Performance Indicators (KPIs):
- CPU Utilization: Measures processor usage, indicating potential bottlenecks.
- Memory Usage: Tracks available memory and potential memory-related performance issues.
- I/O Throughput: Monitors disk read/write speeds, identifying storage-related bottlenecks.
- Query Execution Times: Measures query efficiency, pinpointing slow queries for optimization.
- Blocking and Deadlocks: Identifies queries hindering each other, causing performance issues.
Interpreting Metrics for Informed Decisions:
- Analyze trends: Look for patterns and changes over time to identify potential problems proactively.
- Correlate metrics: Combine insights from multiple metrics to pinpoint root causes of issues.
- Establish baselines: Understand normal performance patterns to distinguish anomalies.
- Prioritize actions: Focus on metrics with the most significant impact on performance and availability.
- Involve experts: Consult experienced DBAs or monitoring specialists for complex scenarios.
Effective monitoring is always an ongoing journey. Continuously refine your approach, adapt to changing needs, and leverage insights to ensure your SQL Server operates at peak performance.
Security Considerations in SQL Server Monitoring
Securing your SQL Server monitoring isn’t just about keeping an eye on performance. You need to safeguard sensitive data with encryption, strict access controls, and activity logging. Secure your monitoring communication channels and data storage, conduct regular security audits, and ensure compliance with data privacy regulations. Remember, your monitoring system itself can be a vulnerability, so prioritize secure practices as you build your SQL Server fortress.
Protecting Sensitive Data:
- Data Encryption: Encrypt sensitive data at rest and in transit to safeguard it from unauthorized access.
- Access Controls: Implement strict user access controls and define permissions to limit data exposure.
- Activity Logging: Track user activity and system events to detect potential security breaches.
- Vulnerability Scanning: Regularly scan for vulnerabilities and implement security patches promptly.
- Compliance Alignment: Ensure monitoring practices align with data privacy regulations like GDPR and HIPAA.
Implementing Secure Monitoring Practices:
- Secure Data Storage: Store monitoring data in encrypted repositories with restricted access.
- Secure Communication Channels: Use secure protocols for data transmission between monitoring tools and servers.
- Regular Security Audits: Conduct periodic audits of monitoring systems and processes to identify and address potential vulnerabilities.
Scaling for Success: Scalability Planning with SQL Server Monitoring
Track usage trends and forecast resource demands to anticipate future growth. Identify potential bottlenecks before they become constraints. Scale smoothly with hardware upgrades, database distribution, or cloud migration. Continuously monitor performance during scaling to address new issues and ensure seamless transitions. Embrace agile infrastructure that adapts to changing demands, and regularly review monitoring data for proactive capacity planning.
Insights for Strategic Scaling:
- Trend Analysis: Track database usage trends and anticipate future growth patterns using monitoring data.
- Resource Forecasting: Predict future resource demands based on current usage and growth projections.
- Bottleneck Identification: Pinpoint components likely to constrain performance under increased load.
Scaling Strategies for Smooth Growth:
- Hardware Upgrades: Increase server capacity by adding processors, memory, or storage.
- Database Scaling: Distribute data across multiple servers or partitions for horizontal scaling.
- Cloud Migration: Leverage cloud-based infrastructure for flexible and scalable resources.
Adapting to Growing Data Demands:
- Monitoring-Driven Optimization: Continuously monitor performance during scaling processes to identify and address new bottlenecks.
- Agile Infrastructure: Embrace infrastructure that can adapt quickly to changing demands.
- Capacity Planning: Regularly review monitoring data to forecast future needs and proactively plan for growth.
Remember, effective SQL Server monitoring isn’t just about troubleshooting issues; it’s about optimizing performance, ensuring security, and planning for future growth. By proactively addressing these areas, you’ll create a robust and scalable database environment that supports your business needs today and into the future.
Empowering Your SQL Server Monitoring Journey: User-Friendly How-To Guides
Here’s a practical guide to key actions within your SQL Server monitoring tools:
1. Setting Up Alerts: Your Early Warning System
- Identify Key Metrics: Determine the most critical KPIs for your environment (e.g., CPU utilization, memory usage, query execution times).
- Define Thresholds: Establish appropriate levels for each metric where an alert should be triggered.
- Configure Alert Delivery: Choose notification methods (email, SMS, integration with ticketing systems) and recipients.
- Test Alerts: Thoroughly test alert functionality to ensure timely and accurate notifications.
2. Customizing Dashboards: Visualizing Your Data, Your Way
- Choose Metrics: Select the KPIs most relevant to your monitoring goals.
- Arrange Visually: Create charts, graphs, and other visual elements to highlight trends and patterns.
- Filter and Group Data: Organize information based on specific criteria for focused insights.
- Tailor to Users: Design dashboards that cater to different roles and responsibilities within your team.
3. Integrating Monitoring into Workflows: Seamlessly Enhancing Operations
- Connect with Ticketing Systems: Integrate with issue-tracking systems to automatically create tickets based on alerts.
- Incorporate into Reporting: Include monitoring data in regular database performance reports.
- Enable Collaboration: Share dashboards and alerts with relevant teams to foster cross-functional awareness and action.
- Automate Responses: Trigger automated actions based on alerts, such as restarting services or scaling resources.
Pro Tips for Success:
- Leverage Tool-Specific Guides: Refer to documentation and tutorials provided by your chosen tool for detailed instructions.
- Seek Community Support: Engage with online communities or forums for assistance and knowledge sharing.
- Experiment and Refine: Continuously adjust configurations and workflows to optimize monitoring effectiveness based on your evolving needs.
Conclusion:
If you’re seeking a comprehensive, one-stop solution for optimizing your SQL Server environment, look no further than SQL Planner. This powerful tool goes beyond mere monitoring, offering a suite of features designed to enhance performance, security, and scalability. Analyze server health, identify root causes of issues, receive timely alerts, and implement automated solutions – all under one intuitive interface. Back up sensitive data securely, streamline audits, tackle fragmentation, and script database objects with ease. SQL Planner’s commitment to cost reduction is impressive, aiming to slash expenses by at least 50% across administration, infrastructure, and management domains. And the best part? Manage everything from anywhere, on any device. Whether you’re a seasoned DBA or just starting your SQL planning journey, SQL Planner offers the flexibility and functionality to empower you every step of the way. Take control of your SQL Server environment today and experience the unparalleled efficiency and cost savings that SQL Planner delivers.