In the relentless world of database management, a sluggish SQL Server throws a wrench in everything. Fear not, for this guide dives headfirst into the realm of SQL Server Performance Monitoring Tools, your trusty allies in optimizing database performance. Packed with practical how-tos and insights, it’s your passport to smooth operations, no matter where your IT adventures take you. Whether you’re in New York’s bustling streets or Kathmandu’s serene valleys, this guide empowers you to conquer bottlenecks, prevent meltdowns, and keep your SQL Server humming like a well-oiled machine.
Why SQL Server Performance Monitoring Tools Matter?
In the bustling digital landscape, a sluggish SQL Server is like a traffic jam in rush hour – frustrating, time-consuming, and bad for business. That’s where SQL Server Performance Monitoring Tools become your guardian angels, guiding you towards peak performance before chaos ensues. Think of them as X-ray glasses for your database, revealing hidden bottlenecks and predicting potential meltdowns before they cause real damage. By proactively monitoring your server’s health, you’re not just ensuring smooth operations, you’re preventing costly outages, optimizing resource allocation, and ultimately guaranteeing happy users and a thriving business. It’s like having a personal trainer for your database, constantly pushing it to reach its full potential. So, ditch the reactive firefighting and embrace the power of proactive monitoring – your SQL Server (and your sanity) will thank you for it.
Benefits of using SQL Server Performance Monitoring Tools
- Real-Time Insights: Like a news feed for your database, these tools deliverinstant updates on performance metrics, resource usage, and potential issues, keeping you in the driver’s seat at all times. Say goodbye to surprises and hello to proactive decision-making.
- Proactive Issue Detection: No more waiting for users to complain about slowness. These tools act like smoke detectors, alerting you to problems before they erupt into full-blown fires. Nip issues in the bud and maintain a healthy, happy database.
- Efficient Resource Utilization: Uncover resource hogs and optimize allocation for peak performance. By identifying underutilized or overused resources, these tools help your server work smarter, not harder, saving you costs and maximizing efficiency.
- Enhanced Security: Protect your valuable data with tools that monitor for suspicious activity and potential breaches. Stay vigilant against threats and safeguard your database fortress.
- Scalability Made Simple: Confidently expand your database operations knowing you have tools to track performance and identify bottlenecks as you grow. Scale with ease and avoid performance pitfalls as your business thrives.
Picking the Perfect Partner: Navigating the Maze of SQL Server Performance Monitoring Tools
Choosing the right SQL Server performance monitoring tool can feel like navigating a labyrinth blindfolded. Fear not, database adventurers! This guide equips you with the map and lantern to make an informed decision.
Popular Pit Stops:
Let’s peek into some popular tools and their strengths:
- Microsoft SQL Server Management Studio (SSMS): Free and built-in, SSMS offers basic monitoring features like performance counters and activity history. Perfect for budget-conscious beginners.
- SolarWinds DPA: A powerful paid option with deep-dive performance analytics, real-time alerts, and cross-platform monitoring. Ideal for large deployments and complex environments.
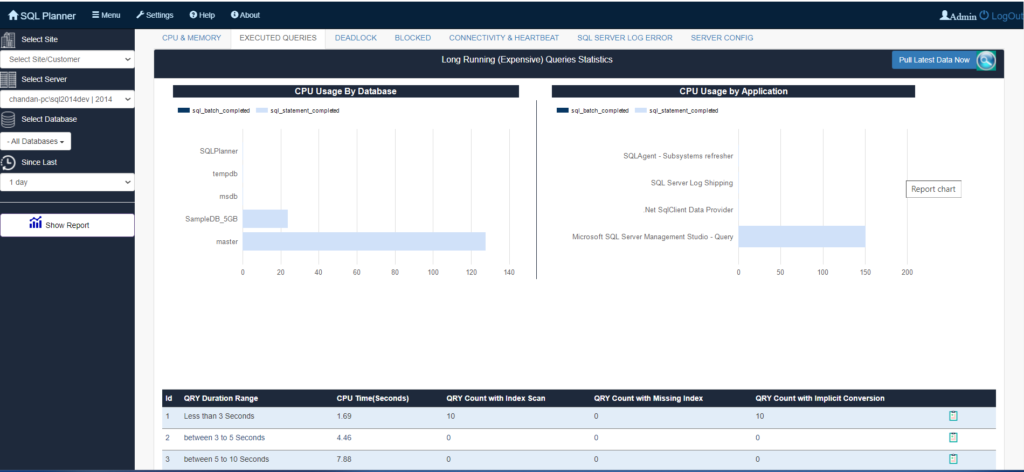
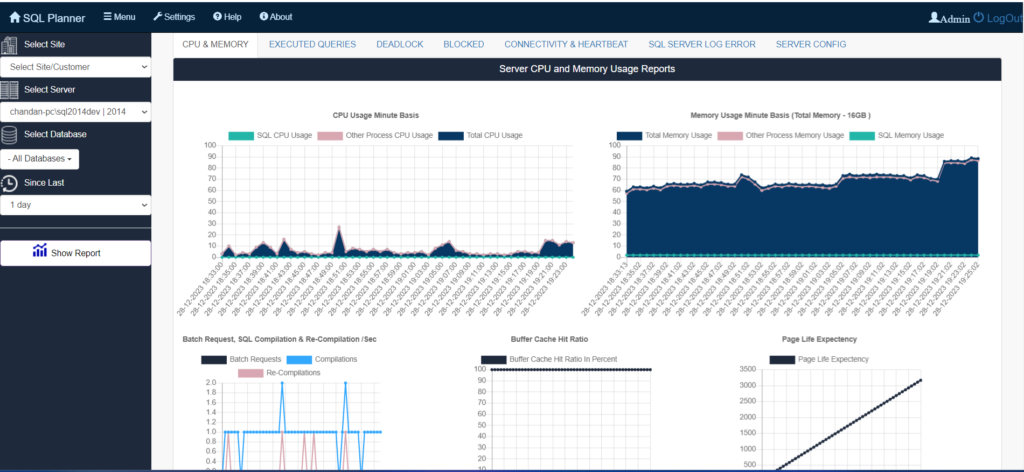
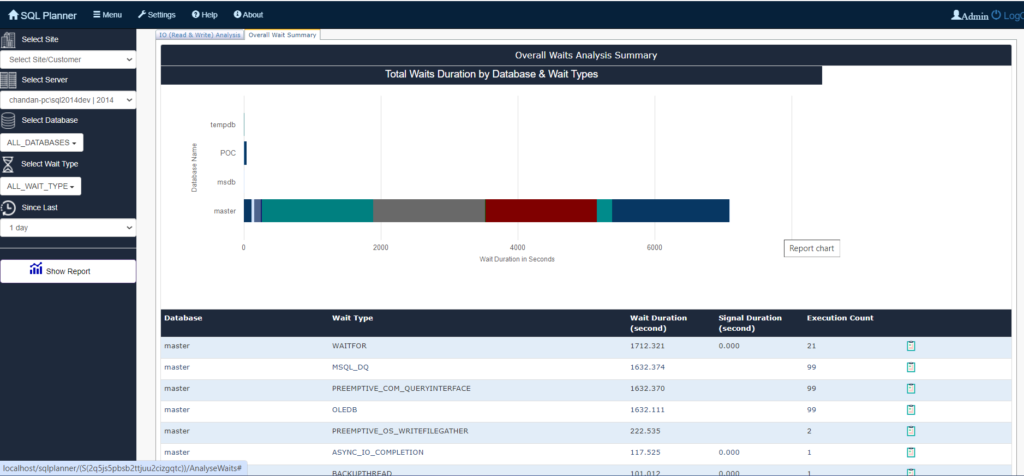
- SQL Planner: Another robust both free& paid tool with comprehensive query analysis, automated tuning recommendations, and historical data management. A great choice for performance optimization and proactive troubleshooting.
- Paessler PRTG: Offers a unified platform for monitoring all your IT infrastructure, including SQL Server. Its customizable dashboards and user-friendly interface make it popular for both beginners and experienced users.
Finding Your Fit:
So, how do you pick the perfect tool for your needs? Consider these factors:
- Monitoring needs: Do you require basic performance stats or advanced query analysis?
- Budget: Free, open-source, or paid options are available.
- Ease of use: Choose a tool with a user-friendly interface and intuitive features.
- Scalability: Will the tool grow with your database needs?
- Integrations: Does it play nicely with other tools you use?
User-Friendly Features Matter:
Look for tools that offer:
- Visual dashboards: See your data come alive with graphs, charts, and color-coded alerts.
- Customizable reporting: Generate reports tailored to your specific needs.
- Mobile access: Monitor your database on the go.
- Automated alerts: Get notified of potential issues before they impact users.
Setting Up Your SQL Server Performance Monitoring Tool
1. Preparation is Key:
- Gather essentials: Collect login credentials, server names, and specific metrics you want to monitor.
- Assess compatibility: Ensure the tool aligns with your SQL Server version and environment.
- Plan for security: Implement firewalls and access restrictions to protect sensitive data.
2. Installation and Configuration:
- Follow official instructions: Adhere to the tool’s specific setup process.
- Define monitoring targets: Choose the servers and databases you want to keep an eye on.
- Customize alerts: Set thresholds for key metrics to receive timely notifications.
- Tailor visualizations: Create dashboards that present data in a clear and actionable way.
3. Integration and Data Collection:
- Connect the dots: Integrate the tool with existing systems like help desks or ticketing software.
- Start data collection: Begin monitoring and gathering performance data.
- Establish a baseline: Record initial performance metrics to measure against in the future.
4. Customization for Success:
- Refine alerts: Adjust thresholds to reduce false alarms and prioritize critical issues.
- Personalize dashboards: Create views that highlight the most relevant information for you.
- Prioritize metrics: Focus on the data that truly impacts your database’s health and performance.
Navigating Common Challenges:
- Data Overload:
- Apply filters to focus on specific areas.
- Create custom views for different stakeholders.
- Utilize baselines to identify significant deviations.
- False Alarms:
- Adjust thresholds to reduce noise.
- Implement alert consolidation to avoid overwhelming notifications.
- Analyze historical data to understand patterns and refine alerts.
- Troubleshooting Hiccups:
- Check tool documentation and support resources.
- Consult online communities and forums for troubleshooting tips.
- Engage with the tool’s vendor for assistance.
Security Matters: Protecting Your Treasure Trove While Monitoring SQL Server Performance
In the fast-paced world of data, balancing performance insights with robust security requires strategic vigilance. While monitoring ensures smooth database operations, neglecting security can turn your tool into a vulnerability. Fear not, data guardians! Here’s how to navigate the delicate dance between performance monitoring and data protection:
Best Practices for Secure Monitoring:
- Embrace the principle of least privilege: Grant users only the minimum access required for their monitoring tasks.
- Lock down server access: Secure your SQL Server with strong passwords, multi-factor authentication, and restricted network access.
- Beware of shadow accounts: Regularly audit user accounts and privileges to identify and eliminate unauthorized access.
- Encrypt the communication channels: Use TLS/SSL encryption to protect data in transit between the monitoring tool and the server.
- Monitor for suspicious activity: Set up alerts for unusual queries, login attempts, or data access patterns.
- Regularly update your tools and server software: Patch vulnerabilities promptly to close potential security gaps.
- Back up your data regularly: Ensure you have a robust backup and recovery plan in place to minimize damage in case of security breaches.
Remember:
- Security is an ongoing journey, not a one-time destination. Regularly review your security policies, monitor for threats, and adapt your approach based on evolving risks.
- Technology is just one piece of the puzzle. Train your staff on safe practices, conduct regular security awareness campaigns, and foster a culture of security within your organization.
By prioritizing security alongside performance monitoring, you can transform your SQL Server into a fortress of data, safe from unwanted intruders and ready to deliver optimal performance for years to come. So, arm yourself with knowledge, vigilance, and best practices, and watch your database shine brightly, a beacon of performance within a secure and impenetrable domain.
Scaling Up Without Breaking Down: Navigating Growth with SQL Server Performance Monitoring Tools
As your business thrives and data demands soar, your SQL Server infrastructure must evolve to keep pace. But how do you know when it’s time to scale, and how can you ensure a smooth expansion without compromising performance? That’s where your trusty performance monitoring tools step in as your scaling guides.
Recognizing the Signals for Growth:
- Persistent Resource Strain: If your monitoring tool consistently reveals maxed-out CPU, memory, or storage, it’s a clear sign that your infrastructure needs a boost.
- Performance Lags Despite Optimization: You’ve tuned queries and indexes, but users still experience slowdowns. This indicates a need for more hardware resources.
- Increased User Load or Data Volume: Significant growth in user numbers or data volume can strain existing infrastructure, necessitating expansion.
- Anticipated Growth: Planning for future expansion proactively is often more cost-effective and less disruptive than reactive scaling.
Scaling with Insights:
- Identify Bottlenecks: Pinpoint the specific components causing constraints—CPU, memory, storage, or network.
- Plan Your Expansion: Choose between scaling vertically (upgrading existing hardware) or horizontally (adding more servers).
- Monitor Throughout the Process: Track performance during and after scaling to ensure success and identify any new bottlenecks.
- Reassess Thresholds and Alerts: Adjust your monitoring tool’s thresholds and alerts to match the expanded infrastructure.
Additional Considerations:
- Application Architecture: Consider how your application interacts with the database when scaling.
- Data Distribution: If using multiple servers, distribute data strategically to optimize performance.
- High Availability: Implement redundancy measures to ensure uptime during scaling and beyond.
Remember:
- Scaling isn’t a one-time event. Regularly monitor performance and be prepared to scale again as needed.
- Don’t scale prematurely. Ensure optimization efforts have been exhausted before scaling.
- Involve all stakeholders. Scaling decisions impact various teams, so collaborate for successful outcomes.
By embracing the insights of your SQL Server Performance Monitoring Tools, you can confidently navigate growth, ensuring your database infrastructure expands seamlessly alongside your business ambitions.
Conclusion
Remember, your SQL Server is a powerful engine, but just like any machine, it thrives on attentive care. Embrace the power of SQL Server Performance Monitoring Tools, and you’ll be cruising on a highway of optimized performance, leaving bottlenecks and slowdowns in the dust. Embrace proactive monitoring, choose the right tool, and unlock the full potential of your database – a well-oiled machine humming with efficiency, security, and satisfied users.
We Hope this helps! Feel free to let us know if you have any other questions.