As there are lot of limitations (unavailable) if you wish to generate Azure SQL DB or PAAS SQL DB performance report.
Gone are those days, SQL Planner provides several health insight, Performance reports, Root-cause along with 20+ alerts on SQL PAAS DB as below :
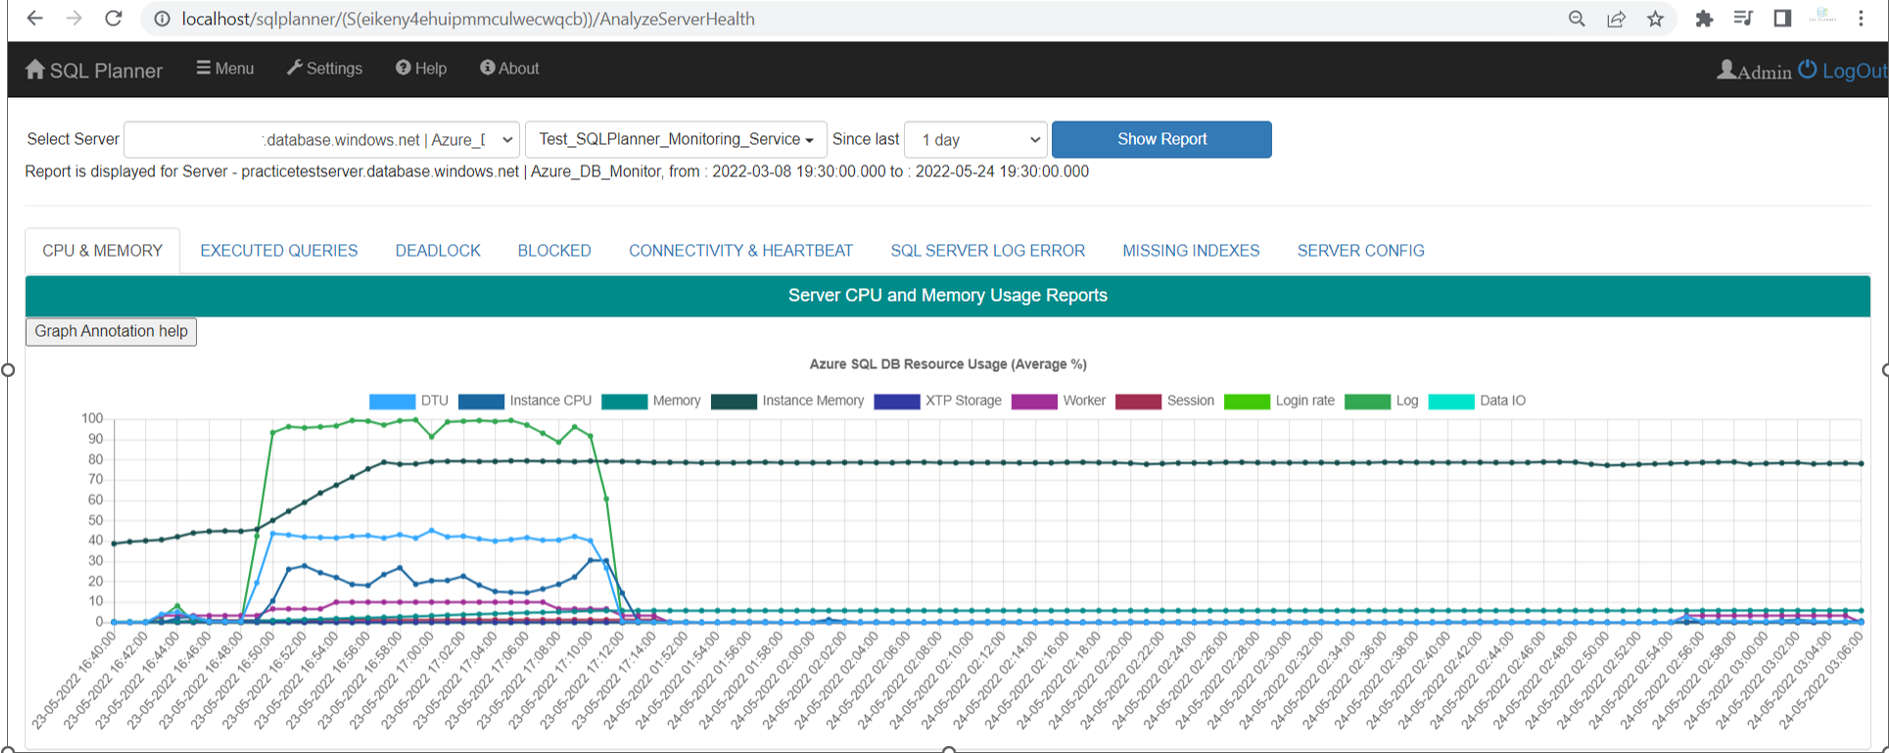
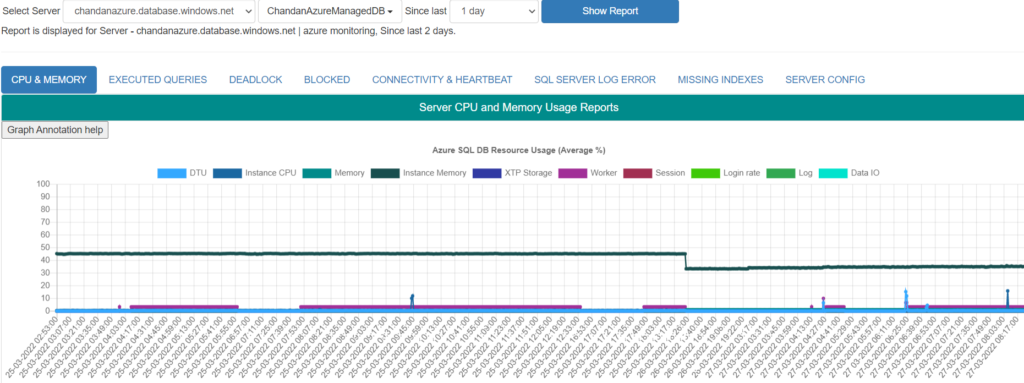
One Graph to explain following :
1. DTU (avg cpu percent) – Average compute utilization in percentage of the limit of the service tier. 2. Data IO (avg data io percent) – Average data I / O utilization in percentage of the limit of the service tier. 3. Log (avg log write percent) – Average transaction log writes(in MBps) as percentage of the service tier limit. 4. Memory (avg memory usage percent) – Average memory utilization in percentage of the limit of the service tier. This includes memory used for buffer pool pages and storage of In – Memory OLTP objects. 5. XTP Storage (xtp storage percent) – Storage utilization for In – Memory OLTP in percentage of the limit of the service tier(at the end of the reporting interval).This includes memory used for storage of the following In – Memory OLTP objects: memory – optimized tables, indexes, and table variables. It also includes memory used for processing ALTER TABLE operations. 6. Worker (max worker percent) – Maximum concurrent workers(requests) in percentage of the limit of the database’s service tier. 7. Session (max session percent) – Maximum concurrent sessions in percentage of the limit of the database’s service tier. 8. Instance CPU (avg instance cpu percent) – Average CPU usage for the SQL Server instance hosting the database, as measured by the operating system. Includes CPU utilization by both user and internal workloads. 9. Instance Memory (avg instance memory percent) – Average memory usage for the SQL Server instance hosting the database, as measured by the operating system. Includes memory utilization by both user and internal workloads.
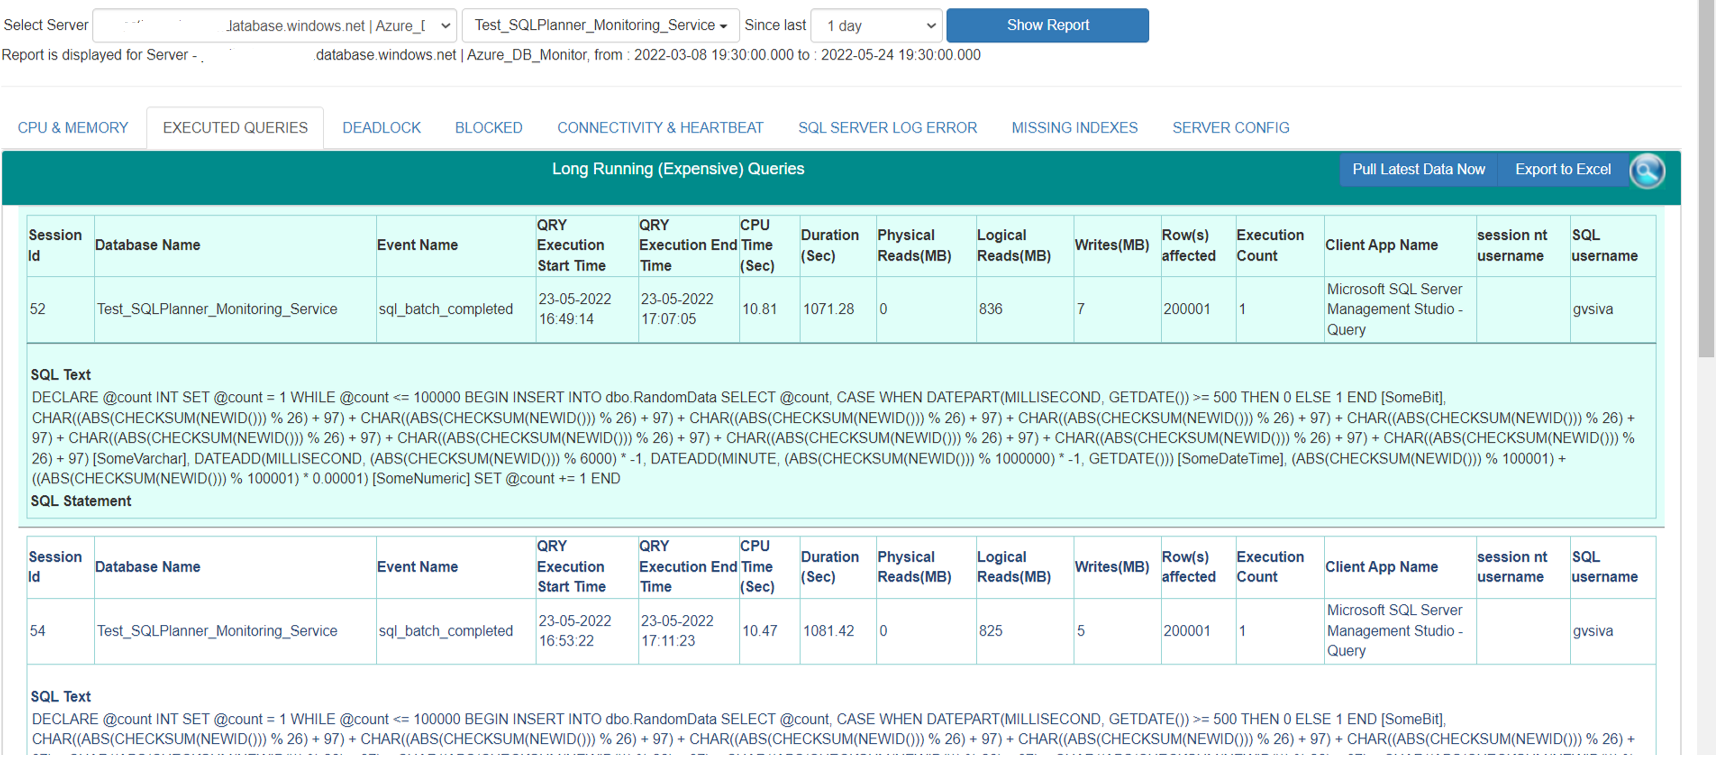
Root cause (expensive query and Stored Proc) for High resource usage
Case when You need to find RCA for high resource usage whenever you receive relevant alert, switch to Executed Query report and find the expensive query / proc by DTU / IO etc.
Deadlock:
Has there been a deadlock which is annoys your customer as their session was auto killed, find them here with RCA detailed level.
Connectivity & Heartbeat :
Has there been a situation when our tool installed at remote machine was unable to reach to PaaS DB , this might be case sometime with your end user too, and then it says it was unable to reach to server.
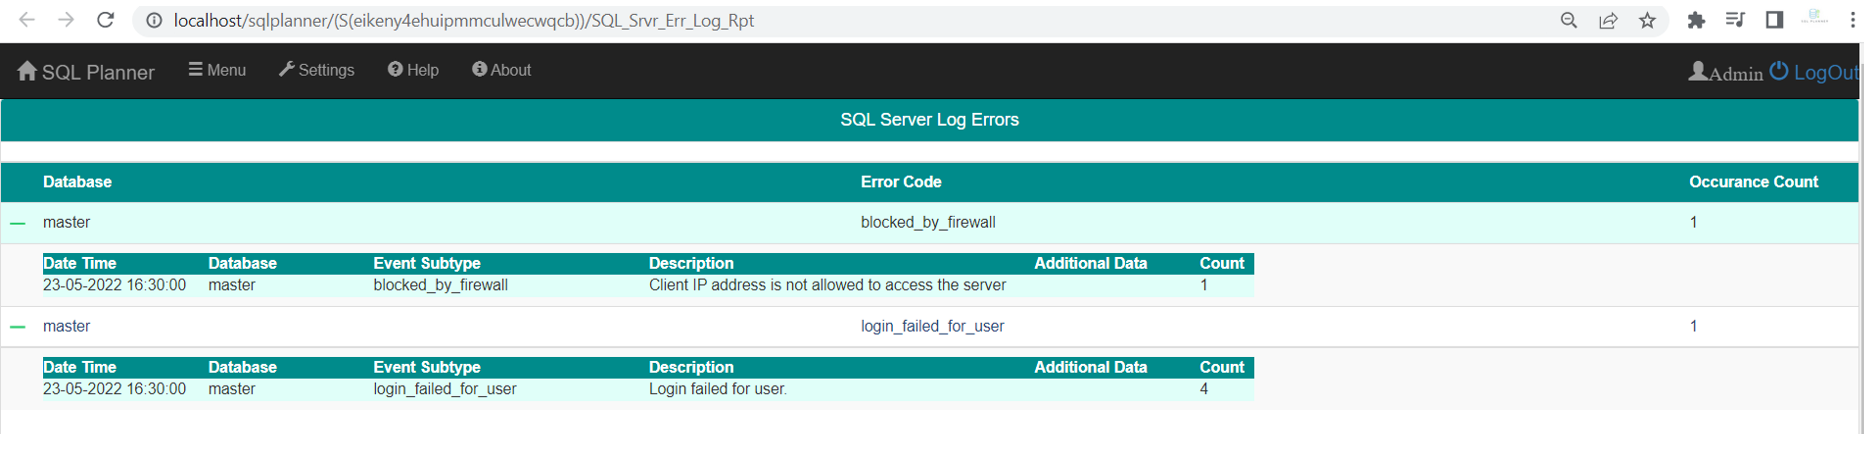
SQL Log Error :
Has there been any error recorded in SQL PaaS DB , example Blocked firewall , invalid login etc. you would never know without tool which shows them quickly that lets you understand more about threat or SQL Issues.
Missing Index
If your SQL PaaS DB ever identified missing index on the query your application processed, SQL Planner will capture and show details about them, this lets you to focus on implementation of those indexes.
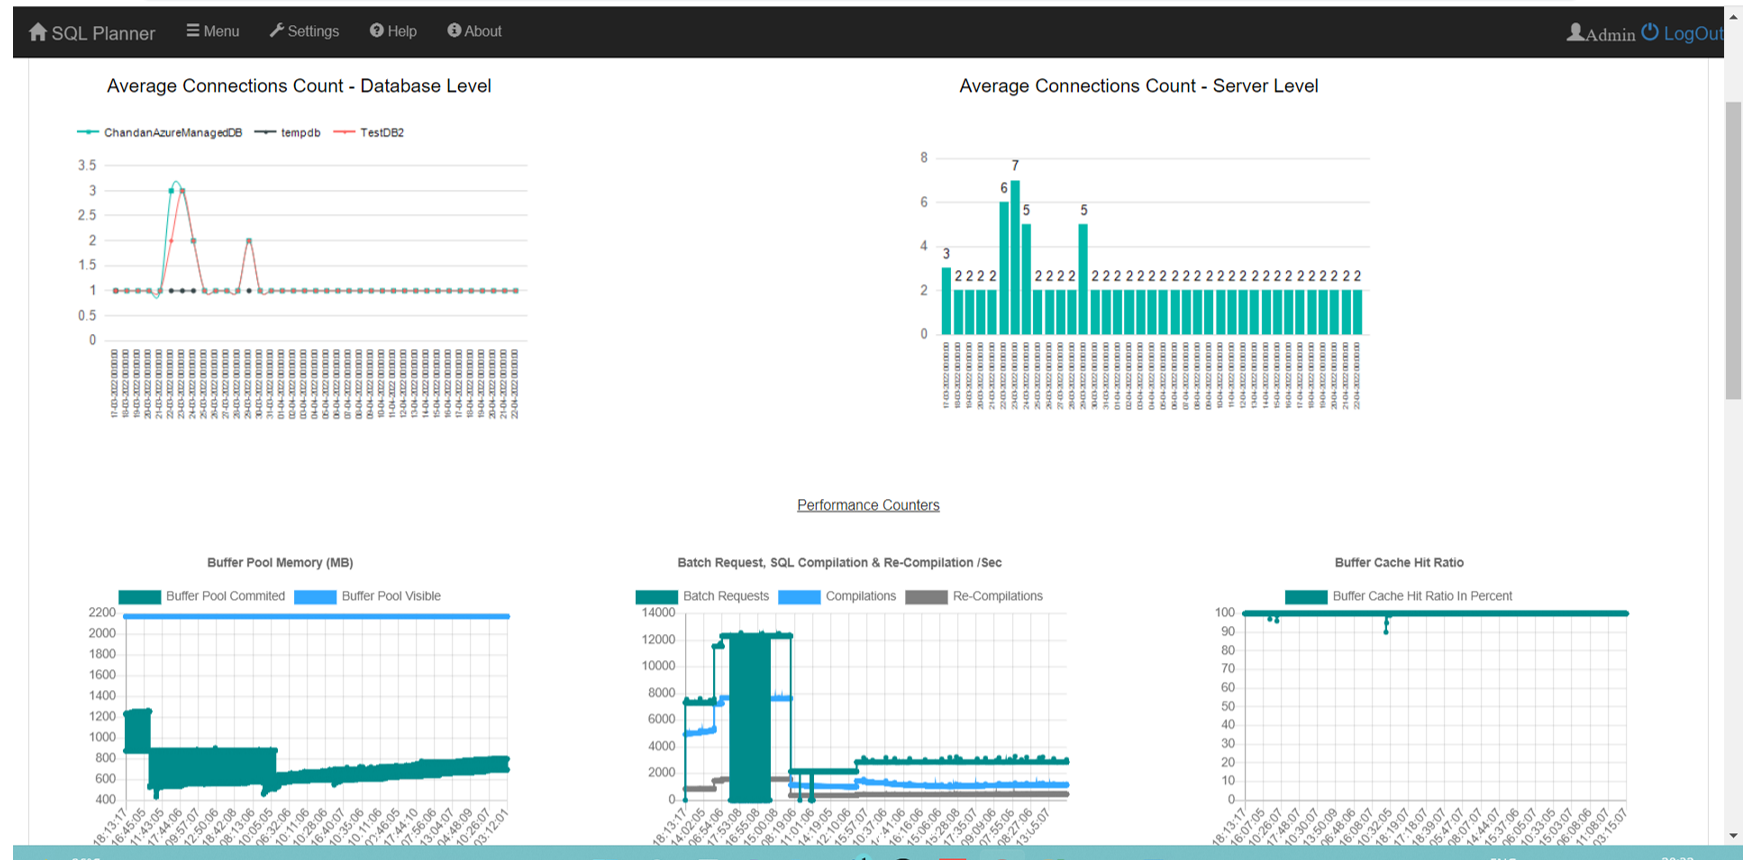
Performance Counters :
To understand overall Server / Database Performance, SQL Planner has special report section on Performance Counter reports such as Average connection at server, DB level, Buffer Pool Memory report, Buffer Cache hit ratio, Batch Request or SQL Compilation, Lazy Write, PLE, Lock Memory Etc.
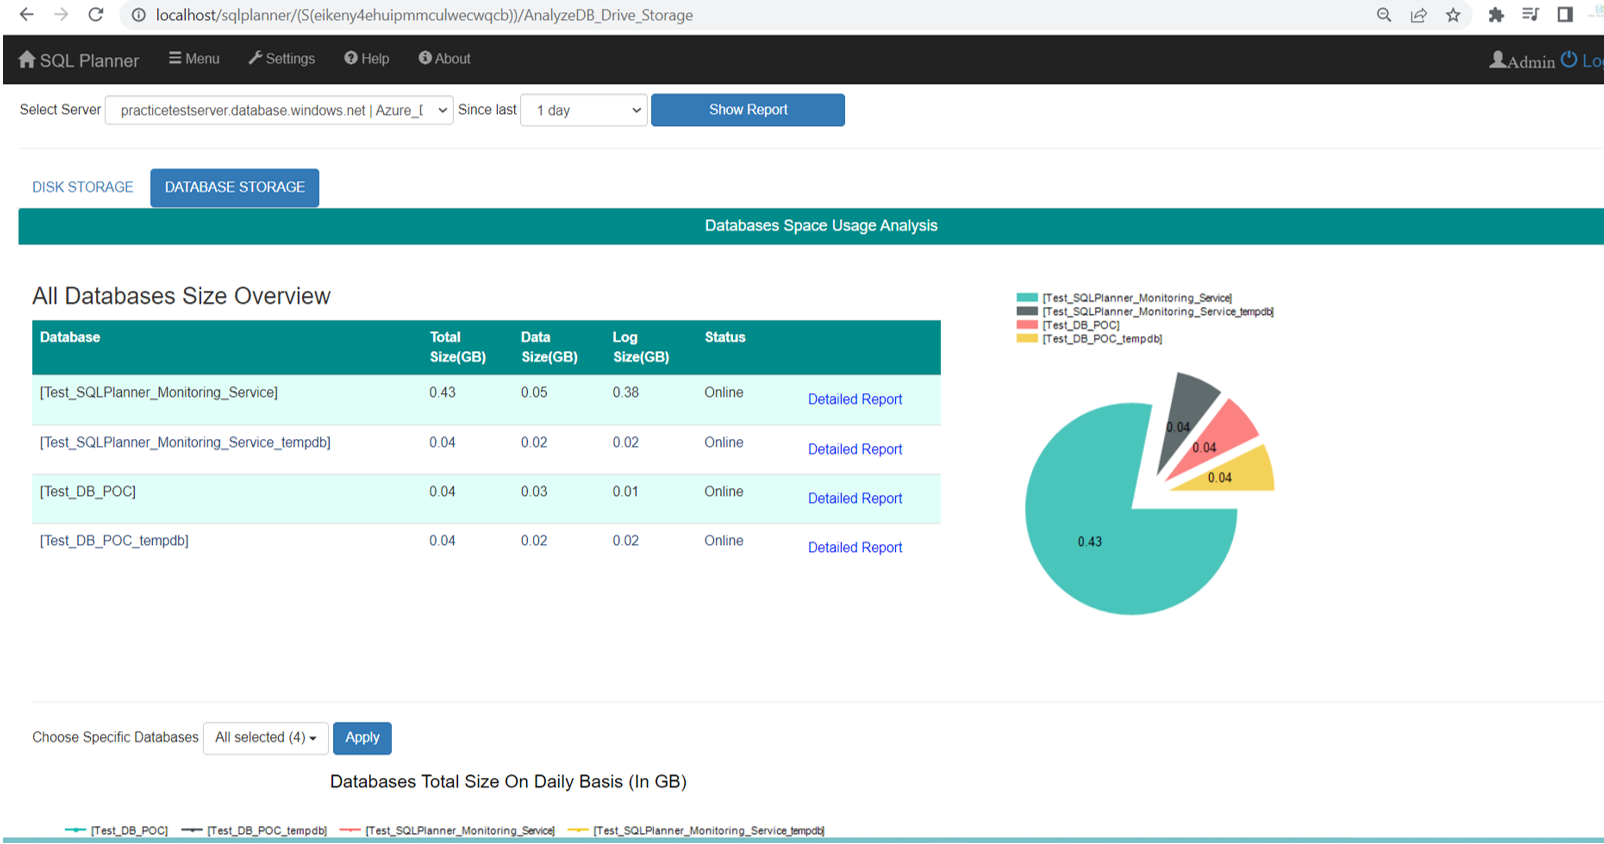
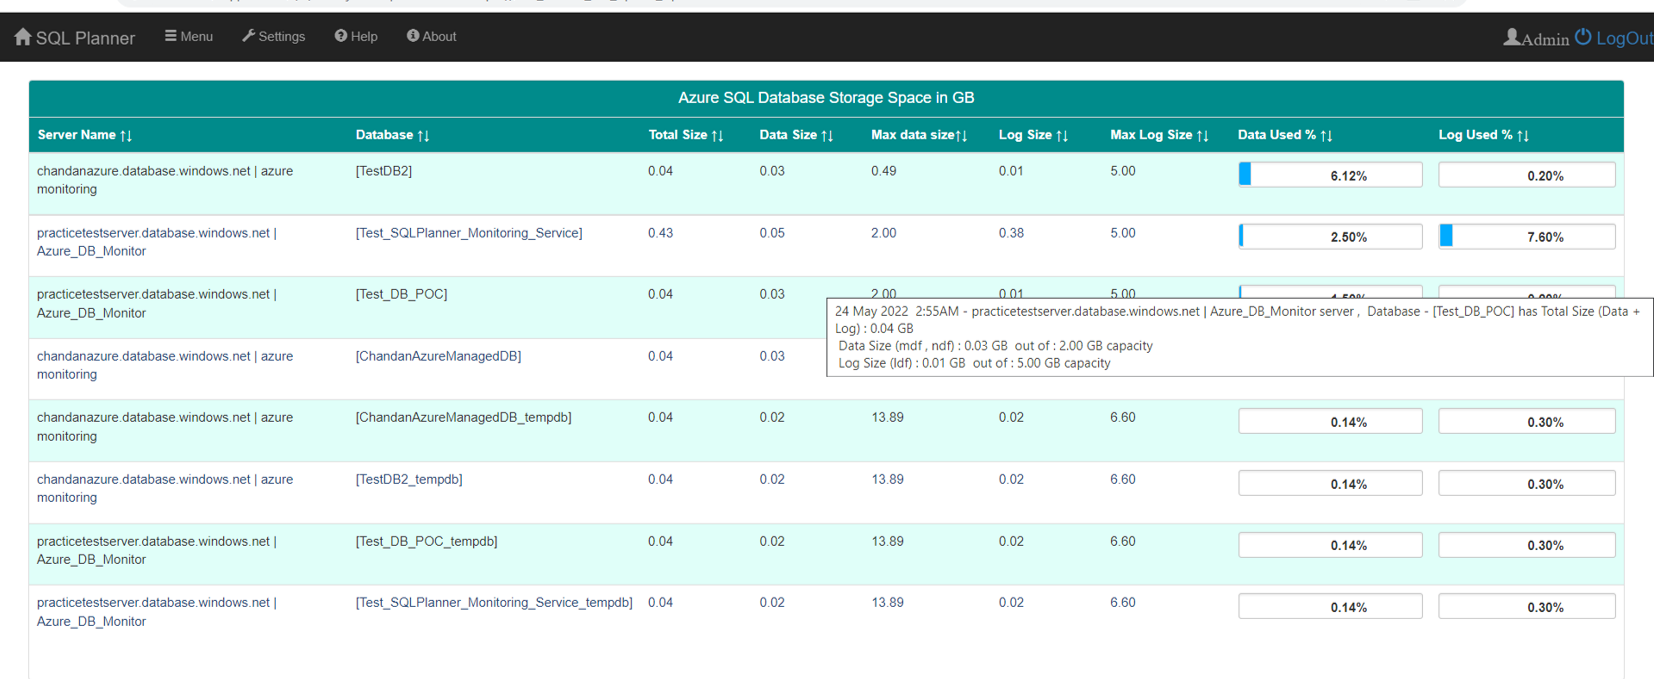
Azure PaaS DB Storage Analysis
Ever there is need to analyse storage / capacity usage, SQL Planner quickly shows all database (data, log including tempdb) file size and further can be drill down to table level too.
A special report shows Storage report from all server and all Database in one single view.
Azure PaaS Alerts / Notification
There are 30+ following important customized conditions when SQL Planner would detect and sends you alert/ notification
Alert Category (PAAS SQL DB)
Rule Description (criteria to trigger email)
High DTU (CPU Computes)
when System CPU average usage is continuously greater than “N% (eg 60%)” since Current time – N minute
High Memory
when System Memory average usage is continuously greater than “N% (eg 60%)” since Current time – N hour
Low Database (Data, Log File) Space
When Database data or Log file space is found to be less than “N% (eg 30%)” space free
connection_failed
When invalid login name ,
login failed for user,
blocked by firewall,
timeout,
long transaction etc occurs
throttling_long_transaction
when excessive tempdb usage,
excessive lock usage,
excessive log space_usage ,
excessive memory usage etc occurs
Deadlock
Whenever Deadlock occurred
Database offline, recovery, suspect
When Database state goes to Offline, Recovery , suspect mode etc which makes application go offline.