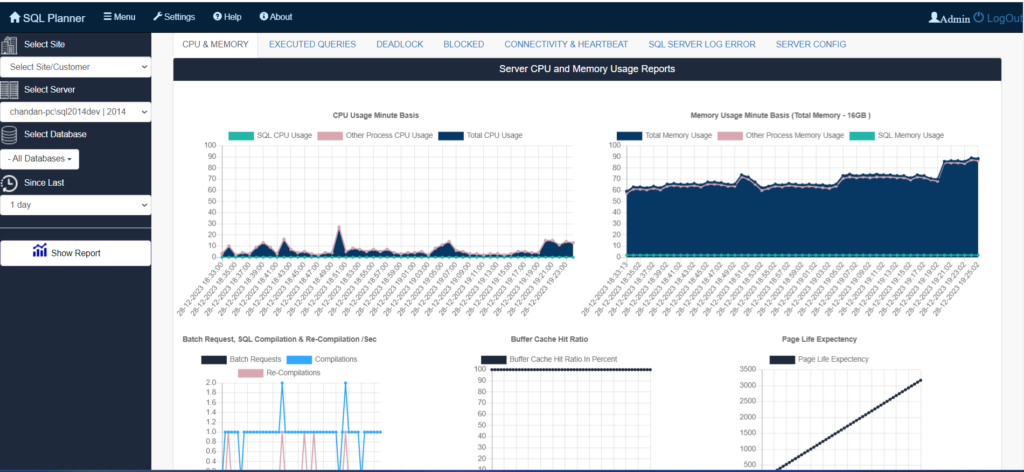
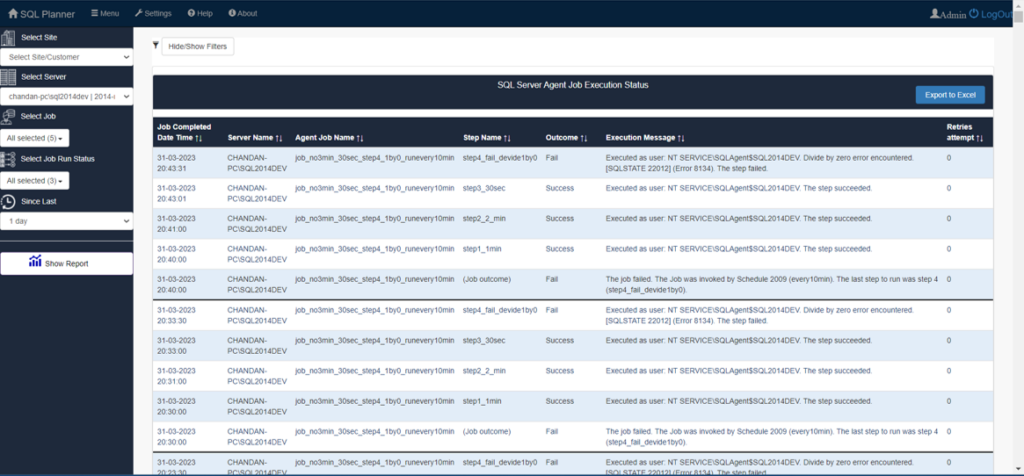
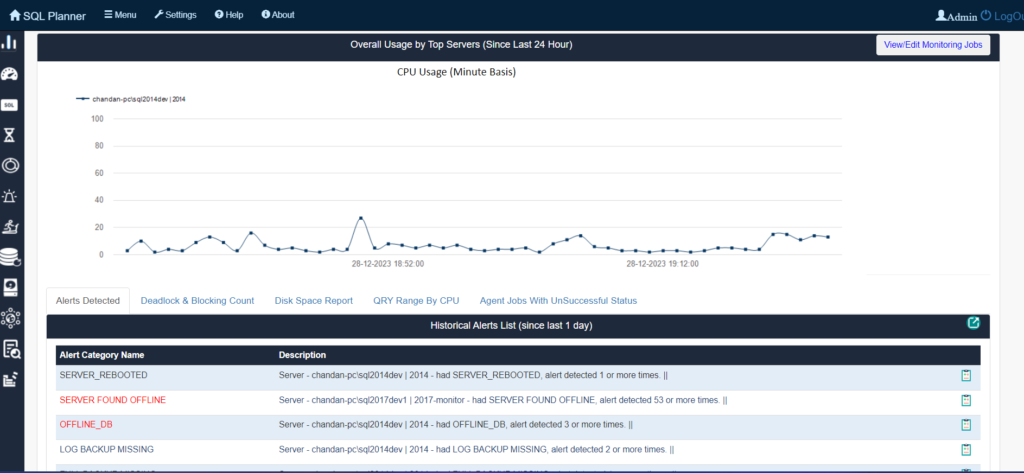
Imagine your SQL Server as a bustling restaurant. Orders fly in, chefs scramble, and ingredients are whisked around – it’s data in motion! Just like the restaurant manager keeps an eye on everything, SQL Server activity monitoring watches how your server handles its tasks.
Think of monitoring as observing three key areas:
- The Kitchen: Are queries flowing smoothly? Are any bottlenecks slowing down orders (data requests)? Monitoring tracks query performance, identifying slow cooks (inefficient queries), and ensuring dishes (data) arrive on time.
- The Ingredients: Are resources like CPU, memory, and disk space sufficient? Monitoring keeps an eye on these “ingredients,” alerting if any run low, potentially causing delays or even disaster (server crashes!).
- The Guests: Are unauthorized guests trying to sneak in? Monitoring acts as a security guard, watching for suspicious activity like hacking attempts or unauthorized access to sensitive data.
So, how does this monitoring make your SQL Server healthier?
- Faster Service: Identifying and fixing slow queries (like inefficient recipes) speeds up data delivery, keeping your hungry users (applications) happy.
- Smoother Operation: By ensuring enough resources are available (like having enough flour and oil), monitoring prevents bottlenecks and server crashes, keeping the restaurant (server) running smoothly.
- Enhanced Security: Catching suspicious activity before it’s too late helps prevent data breaches and unauthorized access, keeping your precious recipes (data) safe.
- Informed Decisions: Monitoring provides valuable insights into server performance, resource usage, and security threats. This data helps you make informed decisions about upgrades, optimizations, and future planning, ensuring your restaurant (server) adapts and thrives.
Just like a restaurant thrives with attentive monitoring, your SQL Server benefits from the watchful eye of activity monitoring. It keeps your data flowing smoothly, protects your information, and helps you make informed decisions to optimize performance and ensure long-term server health. So, open the door to this valuable tool and watch your SQL Server flourish!
Unveiling the Benefits of SQL Server Activity Monitoring: A Treasure Trove of Advantages
Just as a skilled navigator relies on a compass and charts to guide their course, SQL Server activity monitoring provides a wealth of benefits for those who seek to confidently steer their database towards peak performance, robust security, and unwavering compliance. Let’s delve into these advantages and uncover the transformative power of this essential tool:
1. Real-Time Insights: X-Ray Vision for Your Database
- Transparency at Your Fingertips: Gain unparalleled visibility into the inner workings of your SQL Server, observing every query, transaction, and resource utilization in real time.
- Uncover Hidden Patterns: Identify performance trends, resource bottlenecks, and potential issues before they escalate into crippling problems.
- Data-Driven Decisions: Empower yourself with a comprehensive understanding of your server’s health and make informed decisions based on concrete evidence, not guesswork.
2. Proactive Issue Detection: Spotting Trouble Before It Strikes
- Preventive Maintenance: Receive timely alerts when performance metrics exceed thresholds, signaling potential trouble and allowing for proactive intervention.
- Early Intervention: Address issues before they disrupt operations, minimizing downtime, frustrated users, and lost productivity.
- Avoid Catastrophic Failures: Prevent server crashes, data corruption, or security breaches by identifying and addressing problems early on.
3. Improved Performance: Tuning Your Server for Peak Efficiency
- Pinpoint Bottlenecks: Uncover the root causes of slow queries, inefficient processes, or resource constraints, enabling targeted optimization strategies.
- Optimize Resource Allocation: Ensure resources like CPU, memory, and disk space are utilized effectively, maximizing performance and preventing bottlenecks.
- Tailored Solutions: Implement specific actions to address identified issues, such as query tuning, index optimization, or hardware adjustments, leading to a more responsive and efficient server.
4. Enhanced Security: Fortifying Your Data Fortress
- Detect Suspicious Activity: Monitor for unauthorized access attempts, unusual behavior, or potential vulnerabilities, safeguarding your sensitive data from breaches and attacks.
- Proactive Threat Mitigation: Take preventive measures to address security risks, such as patching vulnerabilities, enforcing strong password policies, or implementing intrusion detection systems.
- Protect Data Integrity: Ensure the reliability and accuracy of your data by proactively identifying and addressing any threats to its integrity.
5. Compliance Assurance: Navigating Regulatory Waters with Confidence
- Meet Regulatory Requirements: Many industries have strict data security and privacy regulations. Activity monitoring provides evidence of compliance with these standards, demonstrating accountability and protecting you from potential legal or financial ramifications.
- Audit Trail: Maintain a detailed log of all server activity, enabling thorough investigations, compliance audits, and forensic analysis in case of security incidents.
- Proactive Compliance: Stay ahead of regulatory changes and confidently demonstrate your commitment to data protection and privacy.
SQL Server activity monitoring is not a mere convenience, but a vital investment in the long-term health, security, and compliance of your database. Embrace its power and reap the rewards of a well-tuned, secure, and compliant SQL Server environment, ready to support your business-critical operations with confidence and resilience.
How To Choose the Right SQL Server Activity Monitoring Tools?
Just as a skilled explorer selects the right tools for their expedition, choosing the ideal SQL Server activity monitoring tool requires careful consideration of your unique needs and the terrain you’ll traverse. Let’s embark on a journey to discover the available options and the factors that will guide your selection:
1. Exploring the Popular Tools: A Diverse Landscape Awaits
- Built-in Tools:
- SQL Server Management Studio (SSMS): Offers basic monitoring capabilities, including Activity Monitor, Dynamic Management Views (DMVs), and Extended Events.
- Third-Party Tools:
- SQL Planner: Comprehensive performance, security, and compliance monitoring with advanced features like workload analysis and predictive analytics.
- SolarWinds Database Performance Analyzer: Comprehensive monitoring, troubleshooting, and optimization features with advanced alerts and reporting.
- Idera SQL Diagnostic Manager: Focuses on performance diagnosis, tuning, and capacity planning with detailed insights and actionable recommendations.
- Redgate SQL Monitor: Real-time alerts, customizable dashboards, and historical trend analysis for proactive issue identification.
- Paessler PRTG Network Monitor: Includes SQL Server sensor for basic performance monitoring, suitable for smaller environments or those already using PRTG.

2. Charting Your Course: Factors to Consider
- Features: Assess the specific capabilities you need, such as real-time monitoring, historical analysis, alert thresholds, reporting, security auditing, and compliance features.
- Ease of Use: Evaluate the tool’s interface, customization options, and learning curve to ensure it aligns with your team’s technical expertise.
- Integration: Consider how it integrates with your existing systems, such as ticketing systems, help desks, or SIEM tools.
- Scalability: Ensure the tool can handle your current and future server environments without performance degradation.
- Cost: Compare pricing models and licensing options to fit your budget.
- Deployment Options: Choose between on-premises, cloud-based, or hybrid solutions based on your infrastructure and security preferences.
3. Focusing on User-Friendly Features:
- Intuitive Interface: Simple navigation, clear visualizations, and customizable dashboards for efficient data exploration.
- Customizable Alerts: Set thresholds for key metrics and receive notifications via email, SMS, or integration with other systems.
- Comprehensive Reporting: Generate detailed reports on performance, security, and compliance for analysis and decision-making.
- Historical Data Analysis: Track trends, identify recurring patterns, and predict future resource needs.
- Automated Tasks: Schedule regular maintenance, backups, and other tasks to save time and effort.
The best tool is the one that aligns seamlessly with your unique requirements, technical expertise, and budget. Explore the options, evaluate their features, and consider user-friendliness to make an informed decision. With the right tool in hand, you’ll navigate the complexities of your SQL Server environment with confidence, ensuring optimal performance, robust security, and unwavering compliance.
How to Setup Effective SQL Server Activity Monitoring?
Setting up effective SQL Server activity monitoring is an ongoing process, not a one-time task. Continuously evaluate, adapt, and refine your approach to ensure it delivers maximum value and supports the overall health, security, and performance of your database environment.
1. Choose Your Tool:
- Select the most suitable tool based on your needs, budget, and technical expertise. Refer to the overview provided in the previous response for guidance.
- Consider built-in tools like SSMS for basic monitoring or explore third-party options for advanced features.
2. Install and Configure:
- Follow the tool’s installation instructions, providing the necessary credentials and permissions.
- Configure initial settings, such as:
- Server connections
- Data collection methods (e.g., counters, events, logs)
- Alert thresholds
- Reporting preferences
- Security settings
3. Define Monitoring Goals:
- Identify the specific metrics and events you want to track.
- Align monitoring goals with your overall IT objectives and business priorities.
- Common areas of focus include:
- Performance (CPU, memory, I/O, query execution times)
- Resource utilization
- Blocking and deadlocks
- Security (logins, permissions, failed attempts)
- Compliance (auditing, data privacy regulations)
4. Customize Dashboards and Alerts:
- Create personalized dashboards to visualize key metrics and trends.
- Set alert thresholds to receive notifications when critical events occur.
- Tailor alerts to relevant stakeholders (e.g., DBAs, application owners, security teams).
5. Establish Baselines:
- Collect data for a period to establish normal performance patterns and resource usage.
- Use baselines as a reference to identify anomalies and potential issues.
6. Monitor and Analyze:
- Regularly review collected data and dashboards.
- Investigate alerts promptly to troubleshoot issues.
- Identify patterns and trends to make informed decisions about optimization and resource planning.
7. Refine and Adapt:
- Adjust monitoring configurations as needed based on observed patterns and changing needs.
- Regularly review and update alert thresholds to ensure they remain relevant.
Best Practices for Seamless Integration:
- Involve Stakeholders: Engage relevant teams (DBAs, IT, security, compliance) in the setup and configuration process.
- Document Procedures: Create clear documentation for configuration, usage, and troubleshooting.
- Integrate with Other Systems: Connect with ticketing systems, help desks, or SIEM tools for centralized management and alerting.
- Implement Security Measures: Protect sensitive monitoring data and access to the tool itself.
- Review and Update Regularly: Ensure monitoring remains aligned with evolving needs and best practices.
A Guide on How to Interpret Activity Logs?
Interpreting activity logs effectively takes practice and requires familiarity with your specific server environment and its normal behavior. By understanding key metrics, identifying patterns, and analyzing error messages, you can transform these logs from cryptic entries into valuable tools for optimizing performance, safeguarding security, and ensuring the overall health of your SQL Server.
Key Metrics and Indicators:
- Performance:
- CPU Usage: Measures how much processing power the server is utilizing. High values may indicate bottlenecks or excessive load.
- Memory Utilization: Tracks how much RAM is in use. Consistently high usage can lead to performance degradation.
- Disk I/O: Monitors the rate of data transfer between the server and storage devices. Slow I/O can impact query performance.
- Query Execution Times: Shows how long it takes for queries to complete. Spikes or consistently high values might indicate inefficient queries or resource constraints.
- Resource Usage:
- Connections: Shows the number of clients currently connected to the server. Sudden spikes or sustained high numbers could indicate excessive load or security concerns.
- Locks and Deadlocks: Tracks when queries try to access the same data concurrently, potentially leading to delays or deadlocks (blocking each other).
- Security:
- Login Attempts: Records attempts to access the server, including successful and failed logins. Unusual activity or failed login attempts from unfamiliar locations could indicate security threats.
- Permissions and Access: This shows who has access to what data and what actions they can perform. Monitor for unauthorized access or privilege escalation.

Identifying Patterns and Potential Issues:
- Trends and Correlations: Look for recurring patterns in metrics over time. A sudden rise in CPU usage coinciding with increased query execution times might indicate a bottleneck.
- Thresholds and Alerts: Set thresholds for key metrics and configure alerts to notify you when values exceed acceptable limits.
- Error Messages and Events: Analyze error messages and events logged by the server to identify specific issues, such as failed queries, configuration errors, or resource limitations.
Navigating the Challenges of SQL Server Activity Monitoring:
Managing SQL Server activity monitoring requires balancing performance optimization and security. Administrators implement monitoring systems to track query performance, identify resource-intensive processes, and detect unauthorized access attempts. Achieving a balance between proactive monitoring and minimal impact on system performance is crucial. Adapting to evolving technologies and threats is essential, underscoring the need for administrators to stay informed about the latest tools and best practices in SQL Server activity monitoring. Here we discuss some common challenges and solutions:
- Data Overload:
- Solution:
- Prioritize key metrics and establish meaningful baselines.
- Use filtering and aggregation to focus on relevant data.
- Implement data compression or archiving strategies.
- Consider tools with advanced data visualization and analysis capabilities.
- Solution:
- False Alerts:
- Solution:
- Fine-tune alert thresholds based on historical data and trends.
- Implement intelligent alert suppression or correlation rules to reduce noise.
- Investigate root causes of recurring alerts to address underlying issues.
- Solution:
- Performance Overhead:
- Solution:
- Optimize monitoring tool configuration and data collection methods.
- Schedule monitoring tasks during off-peak hours.
- Consider agentless monitoring options for reduced impact.
- Solution:
- Security Concerns:
- Solution:
- Implement strict access controls and encryption for monitoring data.
- Regularly audit tool configurations and logs for potential vulnerabilities.
- Integrate with SIEM or log management systems for centralized security oversight.
- Solution:
- Troubleshooting Tips:
- Understand Baselines: Compare current data with established baselines to identify anomalies.
- Correlate Metrics: Analyze multiple metrics together to uncover the root cause of issues.
- Leverage Tool Features: Utilize built-in troubleshooting tools and reports.
- Seek Expertise: Consult documentation, online resources, or SQL Server experts.
SQL Server Activity Monitoring: The Silent Guardian of Your Data Security
Activity monitoring is not just about performance optimization; it’s also a vital tool for safeguarding your data fortress. By implementing security best practices and leveraging its capabilities, you can proactively protect your SQL Server from threats and ensure compliance with data privacy regulations.
Enhancing Security and Compliance:
- Active Surveillance: Detects suspicious activity, unauthorized access attempts, and configuration changes in real-time.
- Compliance Auditing: Provides detailed logs for auditing and compliance with regulations like GDPR, HIPAA, and PCI DSS.
- Threat Detection: Identifies potential vulnerabilities, such as outdated software or weak passwords.
- Proactive Measures:
- Enforce strong password policies and access controls.
- Implement encryption for sensitive data.
- Regularly patch vulnerabilities and update software.
- Conduct security audits and penetration testing.
- Train users on cybersecurity best practices.
Conclusion:
SQL Server activity monitoring is not a luxury, but a necessity. It’s your partner in ensuring optimal performance, robust security, and long-term server health. Embrace its power, and watch your SQL Server thrive! Always remember, that proactive monitoring is key to a healthy and secure database environment. Stay vigilant, utilize the tools available, and enjoy peace of mind knowing your valuable data is under constant watch.
